. 2025 Apr;97(4):611-628.
doi: 10.1002/ana.27087. Epub 2025 Jan 24.

Congenital Titinopathy: Comprehensive Characterization of the Most Severe End of the Disease Spectrum

Sandra Coppens  1 Nicolas Deconinck  2 Patricia Sullivan  3 Andrei Smolnikov  4 Joshua S Clayton  5   6 Kaitlyn R Griffin  4 Kristi J Jones  7   8 Catheline N Vilain  1 Hazim Kadhim  9 Samantha J Bryen  7   8 Fathimath Faiz  10 Leigh B Waddell  7   8 Frances J Evesson  7   8   11 Madhura Bakshi  12 Jason R Pinner  13 Amanda Charlton  14 Susan Brammah  15 Nicole S Graf  14 Michael Krivanek  14 Chee Geap Tay  16 Nicola C Foulds  17 Marjorie A Illingworth  18 Neil H Thomas  18 Sian Ellard  19 Ingrid Mazanti  20 Soo-Mi Park  21 Courtney E French  22 Jennifer Brewster  23 Gusztav Belteki  24 Shazia Hoodbhoy  24 Kieren Allinson  25 Deepa Krishnakumar  26 Gareth Baynam  27 Bradley M Wood  28 Michelle Ward  27 Kayal Vijayakumar  29 Amber Syed  29 Archana Murugan  29 Anirban Majumdar  29 Ingrid J Scurr  30 Miranda P Splitt  31 Corina Moldovan  32 Deepthi C de Silva  33 Kumudu Senanayake  34 Thatjana Gardeitchik  35 Yvonne Arens  36 Sandra T Cooper  7   8   11 Nigel G Laing  5   6 F Lucy Raymond  22 Heinz Jungbluth  37   38   39 Erik-Jan Kamsteeg  35 Adnan Manzur  40 Susan M Corley  41 Gianina Ravenscroft  5   6 Marc R Wilkins  4 Mark J Cowley  3 Mark Pinese  3 Titin Research ConsortiumRahul Phadke  40   42 Mark R Davis  10 Francesco Muntoni  40 Emily C Oates  4   43
Collaborators, Affiliations

Congenital Titinopathy: Comprehensive Characterization of the Most Severe End of the Disease Spectrum

Sandra Coppens et al. Ann Neurol. 2025 Apr.

Abstract

Congenital titinopathy has recently emerged as one of the most common congenital muscle disorders.

Objective: To better understand the presentation and clinical needs of the under-characterized extreme end of the congenital titinopathy severity spectrum.

Methods: We comprehensively analyzed the clinical, imaging, pathology, autopsy, and genetic findings in 15 severely affected individuals from 11 families.

Results: Prenatal features included hypokinesia or akinesia and growth restriction. Six pregnancies were terminated. Nine infants were born at or near term with severe-to-profound weakness and required resuscitation. Seven died following withdrawal of life support. Two surviving children require ongoing respiratory support. Most cohort members had at least 1 disease-causing variant predicted to result in some near-normal-length titin expression. The exceptions, from 2 unrelated families, had homozygous truncating variants predicted to induce complete nonsense mediated decay. However, subsequent analyses suggested that the causative variant in each family had an additional previously unrecognized impact on splicing likely to result in some near-normal-length titin expression. This impact was confirmed by minigene assay for 1 variant.

Interpretation: This study confirms the clinical variability of congenital titinopathy. Severely affected individuals succumb prenatally/during infancy, whereas others survive into adulthood. It is likely that this variability is because of differences in the amount and/or length of expressed titin. If confirmed, analysis of titin expression could facilitate clinical prediction and increasing expression might be an effective treatment strategy. Our findings also further-support the hypothesis that some near-normal-length titin expression is essential to early prenatal survival. Sometimes expression of normal/near-normal-length titin is due to disease-causing variants having an additional impact on splicing. ANN NEUROL 2025;97:611-628.


Conflict of interest statement

Nothing to report.

Figures
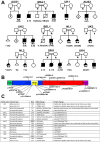
FIGURE 1
FIGURE 1
Pedigrees and summary of disease‐causing variants. (A) Pedigrees of all families included in this study. Clinically affected individuals are represented with shaded symbols. Standard pedigree symbols used were used in this figure. Symbols * and # represent paternal and maternal TTN alleles in cases with genetically confirmed compound heterozygous disease‐causing variants. Symbols ** represent cases with genetically confirmed homozygous disease‐causing variants. Age at spontaneous pregnancy loss, pregnancy termination, death, or stillbirth (SB) is shown beneath pedigree member symbols (h: hours, d: days, w: weeks). F and M in brackets represents gender of terminated pregnancies (F: female, M: male). (B) Location of each of the disease‐causing variants identified in the cohort mapped to the inferred complete TTN metatranscript (Refseq transcript NM_001267550.1). Splice site disease‐causing variants are shown above the transcript image. Frameshift and nonsense disease‐causing variants are shown below the transcript. (Schematic image was created using Illustrator for Biological Sequences.) (C) Table summarizing all the disease‐causing variants identified in the cohort, numbered according to the inferred complete TTN metatranscript. The table also shows the type of variant, the exon in which each disease‐causing variant is located and the predicted impact of each disease‐causing variant at the RNA and/or protein level. A shaded exon number represents disease‐causing variants in metatranscript‐only (non‐N2A) exons. Symbol ^ represents recurrent cohort disease‐causing variants. More detailed information about the position and predicted (or experimentally, for example, RNA‐seq confirmed) impacts of each disease‐causing variant is provided in Table S1. [Color figure can be viewed at www.annalsofneurology.org]
FIGURE 2
FIGURE 2
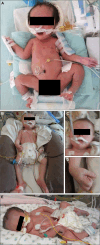
Examples of clinical features seen in severely affected cohort members. (A) Image of MAL1.II.4 shortly after Caesarean breech delivery showing typical hypotonic “frog‐leg” positioning, multiple limb and toe contractures, generalized muscle hypotrophy/wasting, almost complete absence of palmar creases (best seen in left hand), and ventilatory/life support equipment in situ. (B–D) Images of BEL1.II.2 show in B and D, multiple limb wrist and finger contractures, ventilatory/life support equipment (B), and in C, the relative absence of facial weakness. (E) Image of UK2.II.6 showing multiple limb contractures, bilateral wrist contractures, bilateral talipes equinovarus, and ventilatory/life support equipment. [Color figure can be viewed at www.annalsofneurology.org]
FIGURE 3
FIGURE 3
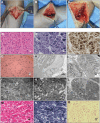
Autopsy, histopathological and ultrastructural features. (A–C) Autopsy images of MAL1.II.4 show near‐complete absence of several limb muscles. (D–O) Light microscopy and ultrastructural (electron micrograph [EM]) images of severely affected cohort member muscle biopsy samples. All brightfield scale bars are 10μm unless otherwise stated. (D) Fiber size variation and internalized nuclei in a hematoxylin and eosin (H&E)‐stained quadriceps section from UK1.II.1 at age 2 months and 3 days. (E,F) Cores and striking central and circumferential peripheral mitochondrial accumulations in a NADHTR‐stained section in E and a COX/SDH double‐stained section in F from the same biopsy shown in D. (G) Atrophic fibers with fiber‐size variation in an H&E‐stained quadriceps section from BEL1.II.2 at age 7 days. (H) EM image showing focal myofibrillar loss from the same biopsy as shown in G. (I) EM image showing rare subsarcolemmal cap‐like lesions comprising mostly thin filaments attached to haphazardly arranged and thickened Z‐lines from the same muscle biopsy as shown in G and H. (J,K) EM images showing marked myofibrillar disarray in a quadriceps section from UK2.II.6 on day 1 of life. (L) EM image showing focal extensive loss of myofibrils with striking mitochondrial proliferations from the same muscle biopsy shown in J and K. (M) Fiber size variation and slightly increased central nucleation in an H&E‐stained quadriceps section from AUS1.II.3 at age 1 day (note: a section of this image was previously published in Oates et al22: patient passed away shortly after biopsy was taken). (N) Indistinct fiber typing in a NADHTR‐stained section of the same muscle biopsy as shown in M. (O) Extreme fiber size variation in an H&E‐stained section from UK3.II.1 (autopsy after termination of pregnancy at 27 + 5 weeks gestation). [Color figure can be viewed at www.annalsofneurology.org]
FIGURE 4
FIGURE 4
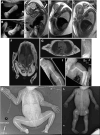
Examples of prenatal and postnatal radiological features. (A,B) Ultrasound of AUS2.II.3 at 30 + 6/40 weeks gestation performed to investigate markedly reduced fetal movements shows persistent lower limb flexion in A and an unusual flexion deformity of the toes in B. (C–E) Fetal magnetic resonance imaging (MRI) of the same infant (AUS2.II.3) at 31 + 4/40 weeks gestation (sagittal SSFSE T2 images, orientation: arm upper left, thigh lower left, back on right of D) shows persistent upper and lower limb flexion deformities, marked limb muscle atrophy, intrinsic hand muscle atrophy (arrow, E) and marked paravertebral muscle atrophy (best seen in C), particularly in neck (arrow, C). Atrophy of the tongue and facial muscles was also present. (F,G) Postnatal MRI (T1 images) of lower limbs in UK4.II.6 demonstrate severe fatty replacement of the lower limb muscles (F, coronal) and proximal upper limb muscles (G, axial). (H–J) Postnatal X‐ray images of UK4.II.6 showing a severe hindfoot varus deformity (H), and displaced fractures of the left humerus (I) and left femur (J). (K) Babygram X‐ray of MAL1.II.4 showing a displaced fracture of the left humerus. Thin gracile ribs and thin long bones, bilateral talipes equinovarus, and bilateral hip flexion contractures are also evident. (L) Postmortem babygram X‐ray of AUS1.II.3 showing bilateral displaced femur fractures and a slightly displaced fracture of the right humerus, which appeared recent (no evidence of repair). Older changes are seen at distal radius and ulna. Thin ribs, thin long bones, and bilateral talipes equinovarus foot deformities are also evident.
FIGURE 5
FIGURE 5
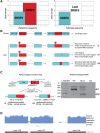
Previously unrecognized splicing impact of the homozygous truncating TTN disease‐causing variant identified in Family SRI1. (A) Strength of exonic splicing enhancer motifs as scored by ESEFinder. Graphs show the location of serine/arginine‐rich splicing factor (SRSF) binding motifs relative to reference (left) and alternative (right) genomic sequence. Alternative sequence contains the Family SRI1 exon 107 nonsense disease‐causing variant (c.29986C>T) (red lettering). (B) Splicing diagrams representing mRNA transcripts predicted to be produced by the reference TTN sequence (normal) and the alternative sequence containing the c.29986C>T disease‐causing variant (SRI1). (C) Minigene splicing assay assessing the impact of the c.29986C>T disease‐causing variant on TTN splicing. Minigene construct (left) contains (left to right) flanking minigene exon (73 bp), minigene intron (577 bp), partial TTN intron 105 (92 bp), TTN exon 106 (268 bp), TTN intron 106 (102 bp), TTN exon 107 (261 bp), partial TTN intron 107 (148 bp), minigene intron (868 bp), and minigene exon (499 bp). TTN exon 107 contains the c.29986C>T variant (black) and the alternative splice site (blue). Predominant mRNA products expressed in HEK293FT cells identified by reverse transcription polymerase chain reaction (RT‐PCR) shown below minigene construct map. (C) Minigene assay RT‐PCR products from wild‐type construct (WT), mutant (MUT), and negative control (NC). Although low level usage of the cryptic acceptor splice site can be seen in the WT minigene result (iii), in the presence of the c.29986C>T disease‐causing variant (MUT) there is a clear shift from the predominant 764 bp wild‐type RNA produced by linear exonic splicing (i) to a predominant 581 bp mutant RNA produced by usage of the alternative splice site (iii). (D) Sashimi plots of TTN splicing patterns in control fetal and pediatric skeletal muscle as identified by RNA‐sequencing. Areas of less intense blue color reflect regions with more variable sequencing coverage (superimposed datasets). Plots show predominantly linear splicing in control muscle with only 16 reads corresponding to low‐level usage of the alternate splice site in exon 107. [Color figure can be viewed at www.annalsofneurology.org]

References

    1. Bang ML, Centner T, Fornoff F, et al. The complete gene sequence of titin, expression of an unusual approximately 700‐kDa titin isoform, and its interaction with obscurin identify a novel Z‐line to I‐band linking system. Circ Res 2001;89:1065–1072. 10.1161/hh2301.100981. - DOI - PubMed
    1. Whiting A, Wardale J, Trinick J. Does titin regulate the length of muscle thick filaments? J Mol Biol 1989;205:263–268. - PubMed
    1. Tskhovrebova L, Trinick J. Titin: properties and family relationships. Nat Rev Mol Cell Biol 2003;4:679–689. 10.1038/nrm1198. - DOI - PubMed
    1. Ehler E, Gautel M. The sarcomere and sarcomerogenesis. Adv Exp Med Biol 2008;642:1–14. 10.1007/978-0-387-84847-1_1. - DOI - PubMed
    1. Gautel M, Djinović‐Carugo K. The sarcomeric cytoskeleton: from molecules to motion. J Exp Biol 2016;219:135–145. 10.1242/jeb.124941. - DOI - PubMed

LinkOut - more resources