

Evaluating Meta-Learners to Analyze Treatment Heterogeneity in Survival Data: Application to Electronic Health Records of Pediatric Asthma Care in COVID-19 Pandemic
- PMID: 39853815
- PMCID: PMC11758764
- DOI: 10.1002/sim.10333
Evaluating Meta-Learners to Analyze Treatment Heterogeneity in Survival Data: Application to Electronic Health Records of Pediatric Asthma Care in COVID-19 Pandemic
Abstract
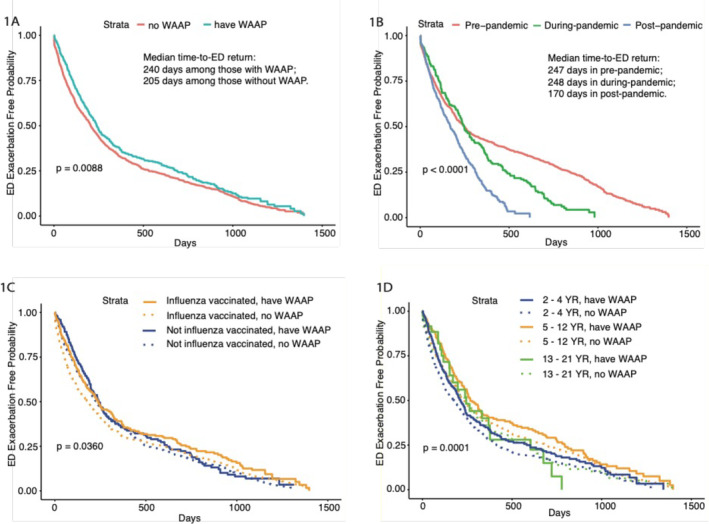
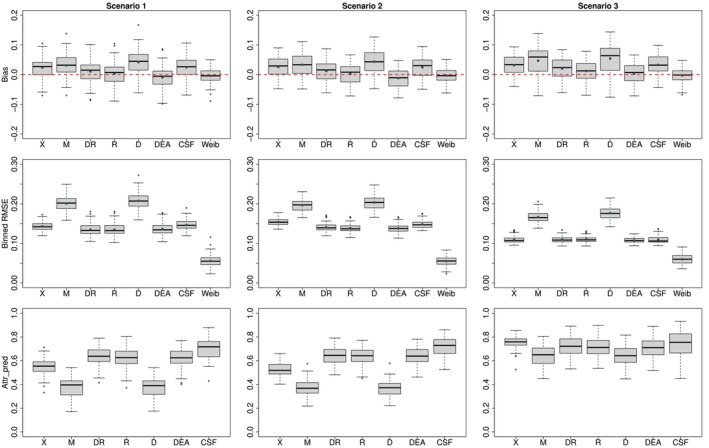
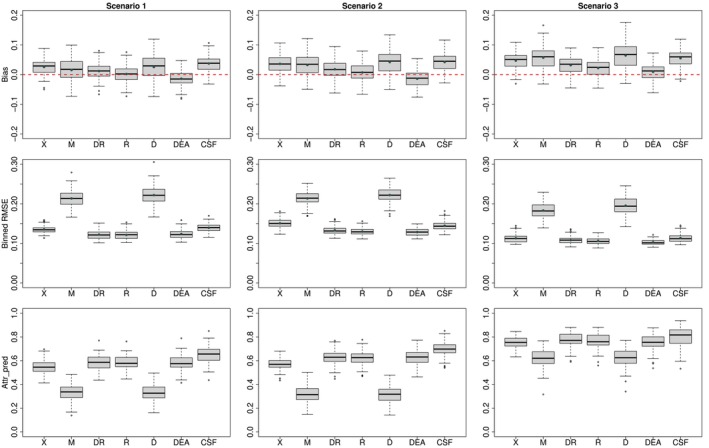
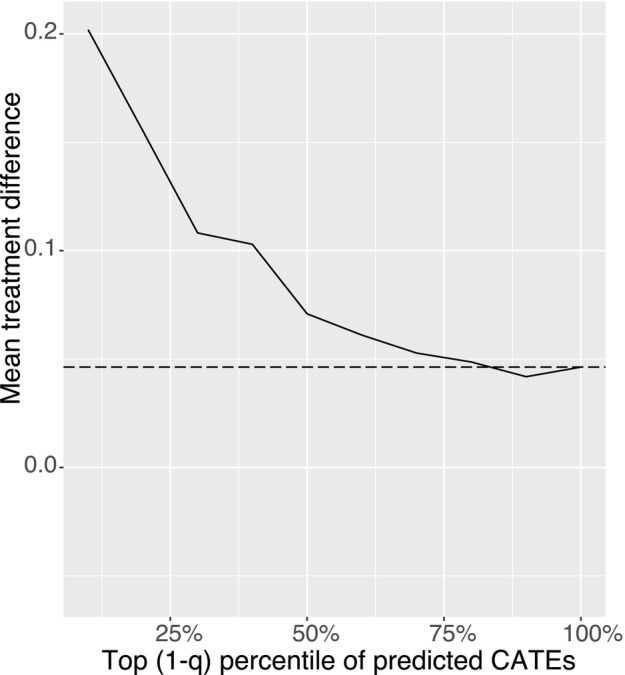
An important aspect of precision medicine focuses on characterizing diverse responses to treatment due to unique patient characteristics, also known as heterogeneous treatment effects (HTE) or individualized treatment effects (ITE), and identifying beneficial subgroups with enhanced treatment effects. Estimating HTE with right-censored data in observational studies remains challenging. In this paper, we propose a pseudo-ITE-based framework for analyzing HTE in survival data, which includes a group of meta-learners for estimating HTE, a variable importance metric for identifying predictive variables to HTE, and a data-adaptive procedure to select subgroups with enhanced treatment effects. We evaluate the finite sample performance of the framework under various observational study settings. Furthermore, we applied the proposed methods to analyze the treatment heterogeneity of a written asthma action plan (WAAP) on time-to-ED (Emergency Department) return due to asthma exacerbation using a large asthma electronic health records dataset with visit records expanded from pre- to post-COVID-19 pandemic. We identified vulnerable subgroups of patients with poorer asthma outcomes but enhanced benefits from WAAP and characterized patient profiles. Our research provides valuable insights for healthcare providers on the strategic distribution of WAAP, particularly during disruptive public health crises, ultimately improving the management and control of pediatric asthma.
Keywords: COVID‐19 pandemic; EHR data; heterogeneous treatment effects; meta‐learner; precision asthma care; subgroup analysis.
© 2025 The Author(s). Statistics in Medicine published by John Wiley & Sons Ltd.
Conflict of interest statement
The authors declare no conflicts of interest.
Figures
Similar articles
-
Providing individualized written asthma action plans during the pediatric emergency department visit.J Asthma. 2021 Jun;58(6):819-824. doi: 10.1080/02770903.2020.1731824. Epub 2020 Mar 6. J Asthma. 2021. PMID: 32066290 Clinical Trial.
-
Reduced pediatric urgent asthma utilization and exacerbations during the COVID-19 pandemic.Pediatr Pulmonol. 2021 Oct;56(10):3166-3173. doi: 10.1002/ppul.25578. Epub 2021 Jul 21. Pediatr Pulmonol. 2021. PMID: 34289526 Free PMC article.
-
Evaluating the impact of coronavirus disease 2019 on asthma morbidity: A comprehensive analysis of potential influencing factors.Ann Allergy Asthma Immunol. 2021 Jul;127(1):91-99. doi: 10.1016/j.anai.2021.03.018. Epub 2021 Mar 26. Ann Allergy Asthma Immunol. 2021. PMID: 33775900 Free PMC article.
-
Adult patient access to electronic health records.Cochrane Database Syst Rev. 2021 Feb 26;2(2):CD012707. doi: 10.1002/14651858.CD012707.pub2. Cochrane Database Syst Rev. 2021. PMID: 33634854 Free PMC article.
-
School-based self-management interventions for asthma in children and adolescents: a mixed methods systematic review.Cochrane Database Syst Rev. 2019 Jan 28;1(1):CD011651. doi: 10.1002/14651858.CD011651.pub2. Cochrane Database Syst Rev. 2019. PMID: 30687940 Free PMC article.
References
-
- Xu Y., Ignatiadis N., Sverdrup E., Fleming S., Wager S., and Shah N., “Treatment Heterogeneity With Survival Outcomes,” in Handbook of Matching and Weighting Adjustments for Causal Inference, 1st ed., eds. Zubizarreta J. R., Stuart E. A., Small D. S., and Rosenbaum P. R. (New York: Chapman and Hall/CRC, 2023), 38.
-
- Bo N., Wei Y., Zeng L., Kang C., and Ding Y., “A Meta‐Learner Framework to Estimate Individualized Treatment Effects for Survival Outcomes,” Journal of Data Science 22, no. 4 (2024): 505–523, 10.6339/24-JDS1119. - DOI
MeSH terms
Grants and funding
LinkOut - more resources
Full Text Sources
Medical