. 2025 Mar;12(11):e2411084.
doi: 10.1002/advs.202411084. Epub 2025 Jan 24.

Turning Waste into Treasure: Functionalized Biomass-Derived Carbon Dots for Superselective Visualization and Eradication of Gram-Positive Bacteria

Affiliations

Turning Waste into Treasure: Functionalized Biomass-Derived Carbon Dots for Superselective Visualization and Eradication of Gram-Positive Bacteria

Ke-Fei Xu et al. Adv Sci (Weinh). 2025 Mar.

Abstract

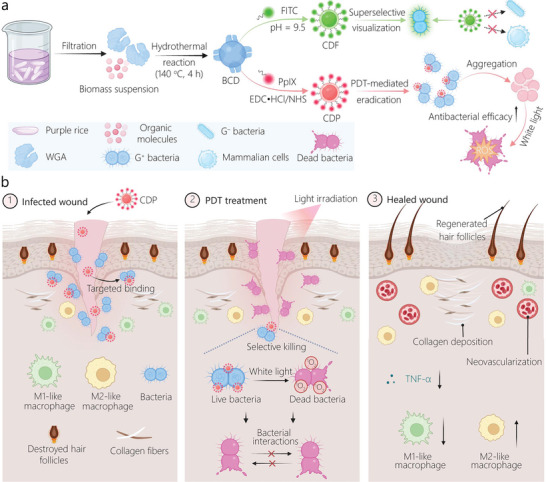
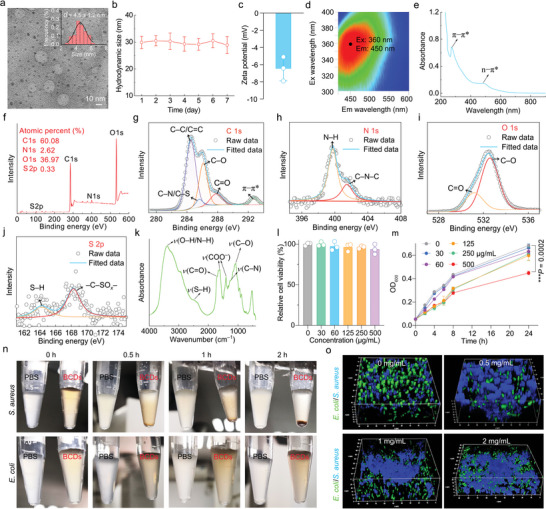
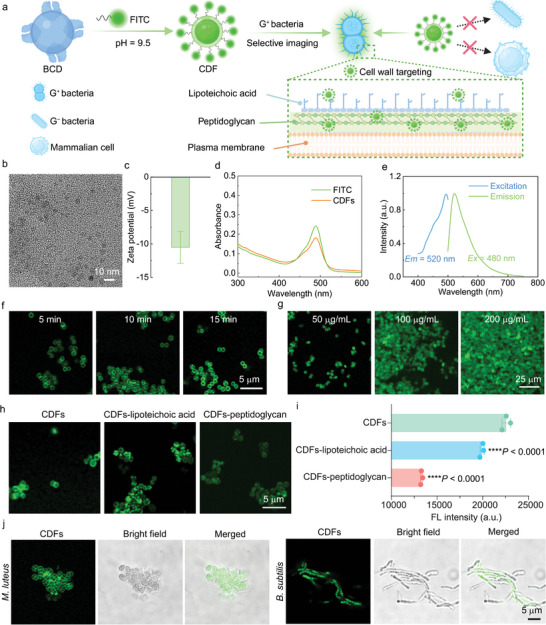
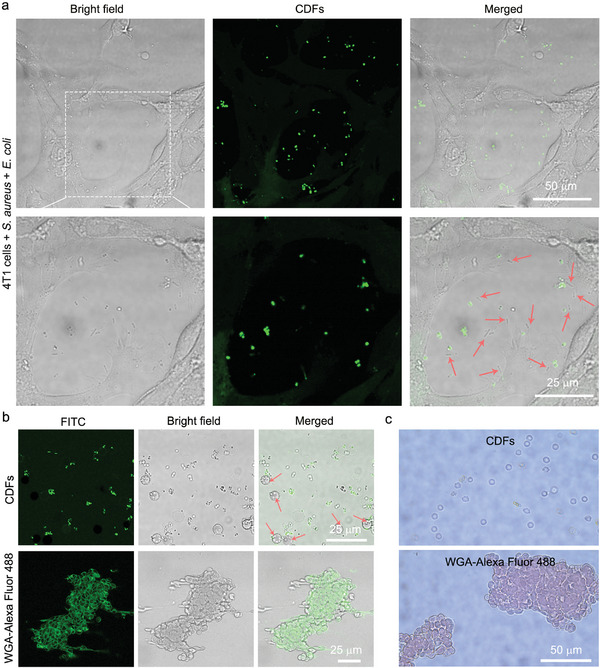
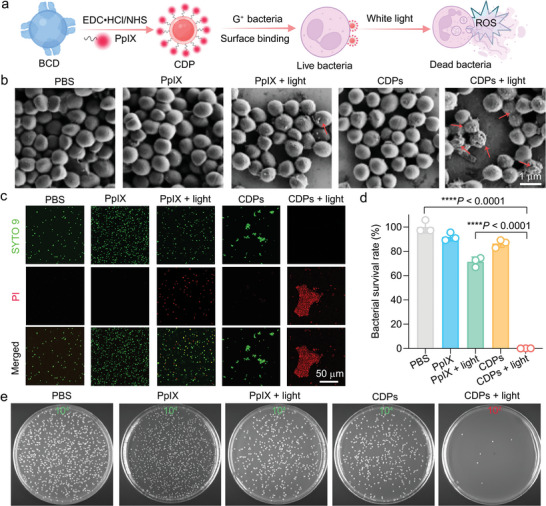
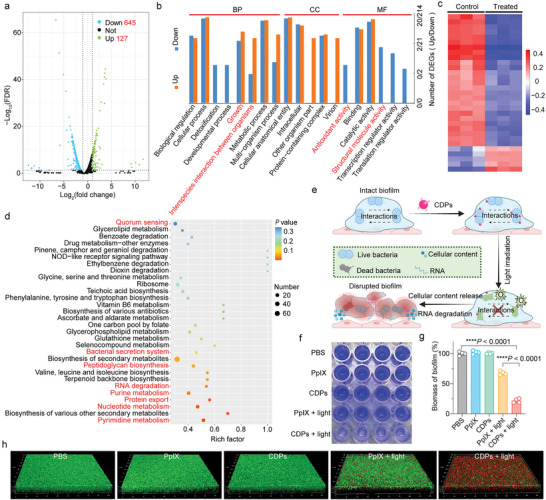
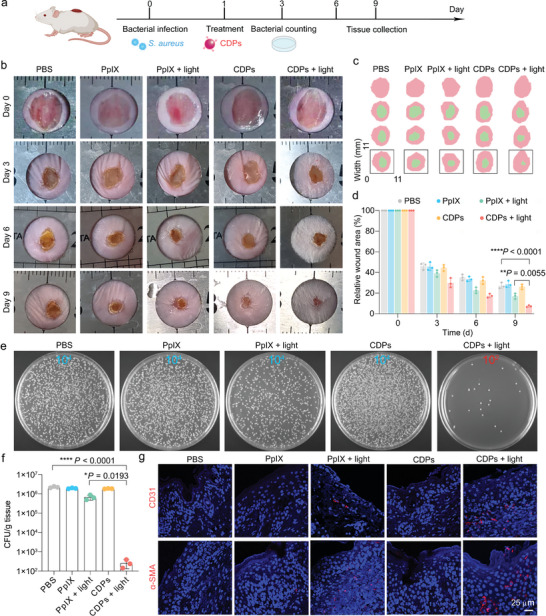
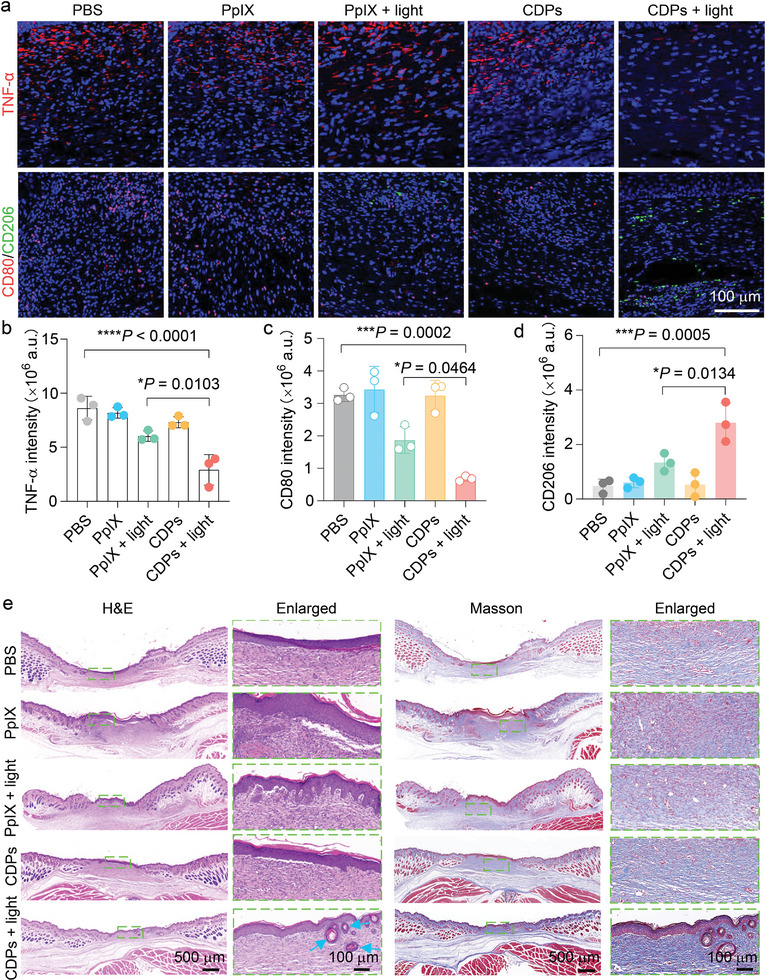
Gram-positive bacteria pose significant threats to human health, necessitating the development of targeted bacterial detection and eradication strategies. Nevertheless, current approaches often suffer from poor targeting specificity. Herein, the study utilizes purple rice lixivium to synthesize biomass carbon dots (termed BCDs) with wheat germ agglutinin-like residues for precisely targeting Gram-positive bacteria. Subsequently, fluorescein isothiocyanate (FITC) molecules are grafted onto BCDs to yield FITC-labeled BCDs (termed CDFs), which can selectively and rapidly (≤5 min) stain bacterial cell wall and particularly target the peptidoglycan component. Strikingly, CDFs achieve superselective visualization of Gram-positive bacteria even in the presence of mammalian cells and Gram-negative bacteria. Furthermore, protoporphyrin (PpIX) molecules are conjugated onto BCDs to yield PpIX-modified BCDs (termed CDPs), which can induce bacterial aggregation and in situ generate singlet oxygen for realizing enhanced antibacterial photodynamic therapy (PDT). At the minimum bactericidal concentration of CDPs (PpIX: 5 µg mL-1), CDP-mediated PDT disrupts bacterial structure and metabolism pathways, thereby affecting bacterial interactions to eradicate biofilms. Importantly, CDP-mediated PDT efficiently modulates antiinflammatory responses to promote wound healing in the bacteria-infected mice. This study underscores the significance of harnessing renewable and cost-effective biomass resources for preparing Gram-positive bacteria-targeting theranostic agents, which may find potential clinical applications in the future.

Keywords: antibacterial therapy; bacterial imaging; biomass carbon dots; cell wall‐targeting probes; wound healing.


Conflict of interest statement

The authors declare no conflict of interest.

Figures

Figure 1
Figure 1
Schematic illustrating the synthesis of functionalized BCDs (i.e., CDFs and CDPs) and their applications for G+ bacteria‐targeted imaging/eradication and wound healing promotion. a) Scheme showing the preparation of CDFs and CDPs and their respective applications for selective imaging and eradication of G+ bacteria. b) Scheme depicting the CDP‐mediated PDT for modulating antiinflammatory responses and promoting the wound healing process of bacteria‐infected mice.
Figure 2
Figure 2
Characterization of BCDs. a) TEM image and corresponding size distribution histogram of BCDs. b) Hydrodynamic diameters of BCDs (dispersed in water) within one week. c) Zeta potential result of BCDs dispersed in PBS (10 mM, pH = 7.4). Data in (b) and (c) are presented as mean ± standard deviation (SD), n  =  3 experimental replicates. d) Excitation–emission contour plot of BCDs (dispersed in PBS). e) UV–vis absorption spectrum of BCDs (dispersed in PBS). f) Survey XPS curve of BCDs and the high‐resolution XPS curves of g) C 1s, h) N 1s, i) O 1s, and j) S 2p. k) FTIR spectrum of BCDs. l) Relative viabilities of 4T1 cells incubated with different concentrations of BCDs for 24 h. m) Growth curves of S. aureus incubated with different concentrations of BCDs for 24 h. Data in (l) and (m) are presented as mean ± SD. n = 3 experimental repeats. n) Photographs of centrifuge tubes containing S. aureus or E. coli (OD600 = 1) suspensions in the absence and presence of BCDs (0.5 mg mL−1) for different time periods. o) 3D confocal fluorescence images of mixed bacteria (S. aureus and E. coli) incubated with different concentrations of BCDs (0, 0.5, 1, and 2 mg mL−1) for 2 h. S. aureus and E. coli were labeled by Hoechst 33342 (blue fluorescence) and SYTO 9 (green fluorescence), respectively.
Figure 3
Figure 3
Characterization of CDFs. a) Schematic illustrating the fabrication of the CDF nanoprobe and its application for selective imaging of G+ bacteria. b) TEM image of CDFs. c) Zeta potential of CDFs dispersed in PBS (10 mM, pH = 7.4). d) UV–vis absorption spectra of FITC (dispersed in dimethyl sulfoxide (DMSO)) and CDFs (dispersed in a mixture of DMSO and water (19 : 1, vol/vol)). e) Excitation and emission fluorescence spectra of CDFs (dispersed in a mixture of DMSO and water (19 : 1, vol/vol)) collected at the corresponding optimal emission and excitation wavelengths. f) Confocal images of S. aureus stained by 50 µg mL−1 CDFs for different time periods. g) Confocal images of S. aureus stained by different concentrations of CDFs for 5 min. h) Confocal images of S. aureus stained by different CDF nanoprobes. CDFs: CDFs without any pretreatment. CDFs‐lipoteichoic acid: CDFs preincubated with 1 mg/mL lipoteichoic acid for 1 h. CDFs‐peptidoglycan: CDFs preincubated with 1 mg mL−1 peptidoglycan for 1 h. i) Corresponding flow cytometry analysis results of the bacterial cells treated similarly as the cells in (h). Data are presented as mean ± SD. n = 3 experimental repeats. Statistical significance in (i) was calculated via one‐way analysis of variance (ANOVA) with a Tukey's post‐hoc test. **** p < 0.0001. j) Confocal images of different G+ bacteria (M. luteus and B. subtilis) stained by 50 µg mL−1 CDFs for 5 min.
Figure 4
Figure 4
Analysis of CDF‐mediated G+ bacterium detection. a) Confocal images of mixed cells (4T1 cells, E. coli, and S. aureus) stained by 0.5 mg mL−1 CDFs for 15 min. The red arrows indicate the unstained E. coli. b) Confocal and c) optical images of the mixed cells (S. aureus and RBCs) stained by 0.5 mg mL−1 CDFs and 0.1 mg mL−1 WGA‐Alexa Fluor 488 for 15 min, respectively. The red arrows in (b) indicate the unstained RBCs.
Figure 5
Figure 5
In vitro antibacterial effect of CDP‐mediated PDT. a) Schematic showing the synthesis of CDPs and CDP‐mediated antibacterial PDT. b) SEM images of S. aureus after different treatments. The red arrows indicate the dead S. aureus with broken cell walls. c) Confocal fluorescence images showing the S. aureus cells after different treatments as indicated. Before imaging, the bacteria in each group were stained by SYTO 9 (6 µm) and PI (30 µm) for 15 min. d) Survival rates of S. aureus after various treatments. Data are presented as mean ± SD. n = 3 experimental repeats. Statistical significance was calculated via one‐way ANOVA with a Tukey's post‐hoc test. **** p < 0.0001. e) Representative photographs showing the agar plates of S. aureus after different treatments. The numbers (102 and 104) in the images indicate the dilution factors of the original bacterial suspensions. (b–e): White light (5 mW cm−2, 10 min) was used for PDT in the “PpIX + light” and “CDPs + light” groups.
Figure 6
Figure 6
Transcriptomic analysis of bacteria after CDP‐mediated PDT treatment and evaluation of biofilm eradication. a) Volcano plot of all DEGs between the control (“PBS”) and treated (“CDPs + light”) groups. b) Histogram presenting the GO enrichment analysis results of some selected DEGs between the control and treated groups. BP: biological process, CC: cellular component, and MF: molecular function. c) Heat map of growth‐related DEGs between the control and treated groups. Red and blue colors indicate the up‐regulation and down‐regulation, respectively. d) Dot plot illustrating the KEGG enrichment analysis results of some selected DEGs between the control and treated groups. Statistical significance in (a–d) was calculated via two‐tailed Student's t‐test. e) Schematic illustrating the CDP‐mediated PDT for biofilm eradication. f) Photograph of the CV staining assay results of S. aureus‐based biofilms after different treatment as indicated. g) Biofilm biomass values after different treatments. The biofilm biomass was quantified by the CV absorbance of the bacterial biofilms in (f). Data are presented as mean ± SD (n = 4 experimental repeats). Statistical significance was calculated via one‐way ANOVA with a Tukey's post‐hoc test. **** p < 0.0001. h) 3D confocal images of S. aureus biofilms after different treatments. Before imaging, the biofilms were stained by the live/dead bacterial viability kit.
Figure 7
Figure 7
Analysis of the antibacterial and wound healing promotion effects of CDP‐mediated PDT. a) Schematic illustration of the experimental schedule. b) Representative photographs of S. aureus‐infected mice taken at different time points after various treatments as indicated. c) Overlapped simulated wound areas (the first day and the 0/3/6/9 day) within 9 days corresponding to (b). d) Histogram showing the time‐dependent relative wound areas of the mice in different groups. Data are presented as mean ± SD. n = 3 mice. e) Representative photographs of the bacterial colonies derived from the homogenized wound tissues at day 3. The numbers (102 and 104) in the images indicate the dilution factors of the original bacterial suspensions. f) Corresponding statistical histogram of the bacterial colonies in (e). Data are presented as mean ± SD. n = 3 mice. g) Representative immunofluorescence staining images of CD31 and α‐SMA in the wound tissue sections from the mice at day 9 after different treatments. Statistical significance in (d) and (f) was calculated via one‐way ANOVA with a Tukey's post‐hoc test. * p < 0.05, ** p < 0.01, **** p < 0.0001.
Figure 8
Figure 8
Evaluation of antiinflammation and wound healing promotion effects of CDP‐mediated PDT. a) Representative immunofluorescence images of TNF‐α and CD80/CD206 in the wound tissue sections from the mice at day 9 after different treatments. Corresponding statistical results of the fluorescence intensities for b) TNF‐α, c) CD80, and d) CD206 in (a). Data are presented as mean ± SD (n = 3 mice). e) Representative H&E and Masson's trichrome staining results of the wound tissue sections from the mice at day 9 after different treatments (blue arrows: blood vessels). Statistical significance in (b–d) was calculated via one‐way ANOVA with a Tukey's post‐hoc test. * p < 0.05, *** p < 0.001, **** p < 0.0001.

Similar articles

References

    1. a) Yuan H., Liu Z., Liu L., Lv F., Wang Y., Wang S., Adv. Mater. 2014, 26, 4333; - PubMed
    2. b) Biswas B. B., Basu P. S., Pal M. K., Int. Rev. Cytol. 1970, 29, 1. - PubMed
    1. Kwon H. Y., Liu X., Choi E. G., Lee J. Y., Choi S. Y., Kim J. Y., Wang L., Park S. J., Kim B., Lee Y. A., Kim J. J., Kang N. Y., Chang Y. T., Angew. Chem. Int. Ed. 2019, 58, 8426. - PubMed
    1. Pak Y. L., Swamy K. M. K., Yoon J., Sensors 2015, 15, 24374. - PMC - PubMed
    1. a) Li X., Bai H., Yang Y., Yoon J., Wang S., Zhang X., Adv. Mater. 2019, 31, 1805092; - PubMed
    2. b) Zhao E., Chen Y., Chen S., Deng H., Gui C., Leung C. W. T., Hong Y., Lam J. W. Y., Tang B. Z., Adv. Mater. 2015, 27, 4931; - PubMed
    3. c) van Oosten M., Schäfer T., Gazendam J. A. C., Ohlsen K., Tsompanidou E., de Goffau M. C., Harmsen H. J. M., Crane L. M. A., Lim E., Francis K. P., Cheung L., Olive M., Ntziachristos V., van Dijl J. M., van Dam G. M., Nat. Commun. 2013, 4, 2584. - PubMed
    1. Li J., Lin S., Wang J., Jia S., Yang M., Hao Z., Zhang X., Chen P. R., J. Am. Chem. Soc. 2013, 135, 7330. - PubMed

LinkOut - more resources