. 2025 May;14(13):e2404477.
doi: 10.1002/adhm.202404477. Epub 2025 Jan 24.

Ischemic Myocardium Targeting Peptide-Guided Nanobubbles for Multimodal Imaging and Treatment of Coronary Microvascular Dysfunction

Affiliations

Ischemic Myocardium Targeting Peptide-Guided Nanobubbles for Multimodal Imaging and Treatment of Coronary Microvascular Dysfunction

Bo Yu et al. Adv Healthc Mater. 2025 May.

Abstract

Coronary microvascular dysfunction (CMD) refers to clinical symptoms caused by structural and functional damage to coronary microcirculation. The timely and precise diagnosis of CMD-related myocardial ischemia is essential for improving patient prognosis. This study describes a method for the multimodal (fluorescence, ultrasonic, and photoacoustic) noninvasive imaging and treatment of CMD based on ischemic myocardium-targeting peptide (IMTP)-guided nanobubbles functionalized with indocyanine green (IMTP/ICG NBs) and characterizes their basic characteristics and in vitro imaging and targeting abilities. The IMTP/ICG NBs enable the accurate location of myocardial ischemia via photoacoustic imaging, and when loaded with tannic acid (TA), can be used to effectively treat myocardial ischemia and fibrosis in CMD mice, achieving an effect superior to that of free TA. The origin of this high therapeutic efficiency is revealed by transcriptomic and proteomic analyses. This investigation lays the groundwork for visual monitoring and the drug-targeted treatment of CMD.

Keywords: coronary microvascular dysfunction; ischemic myocardium; multimodal imaging; nanobubble; tannic acid.


Conflict of interest statement

The authors declare no conflict of interest.

Figures

Scheme 1
Scheme 1
Illustration of nanobubbles containing ischemic myocardium‐targeting peptide (IMTP) and indocyanine green (ICG) without (IMTP/ICG NBs) and with (TA/IMTP/ICG NBs) tannic acid (TA). The IMTP/ICG NBs can achieve cardiomyocyte targeting and enhance the targeted multimodal imaging ability of ischemic myocardium in mice with coronary microvascular dysfunction (CMD). The loading of TA into IMTP‐guided NBs can markedly ameliorate myocardial ischemia and fibrosis in these mice. Imaging modalities facilitated by this platform include fluorescence imaging (FLI), contrast‐enhanced ultrasound (CEUS), and photoacoustic imaging (PAI).
Figure 1
Figure 1
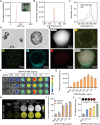
Characteristics of the IMTP/ICG NBs. A) Size distribution of the IMTP/ICG NBs. The inset showed photographs of the IMTP/ICG NBs before (left) and after (right) mechanical vibration. B) Zeta potential of the IMTP/ICG NBs. C) Absorption spectra of the free ICG and IMTP/ICG NBs in the 500–900 nm range. D) Transmission electron microscopy (TEM) image of the IMTP/ICG NBs (scale bar = 500 nm (left) and 100 nm (right)). E) High‐angle angular dark field‐scanning transmission electron microscopy (HAADF‐STEM) mapping of the IMTP/ICG NBs (scale bar = 100 nm), showing the elemental distribution: carbon (yellow), nitrogen (green), oxygen (blue), and sulfur (red). F) In vitro fluorescence (FL) images of saline and different concentrations of IMTP/ICG NBs and G) related quantitative analysis. H) Ultrasound signal images obtained for saline and different concentrations of the IMTP/ICG NBs in vitro and I) quantitative analysis of echo intensity in B‐mode and contrast‐enhanced ultrasound (CEUS) modes. J) Photoacoustic (PA) images and quantitative PA intensities of IMTP/ICG NBs at different concentrations in vitro under 780 nm excitation.
Figure 2
Figure 2
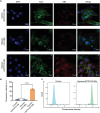
Targeting efficiency in vitro. A) Confocal laser scanning microscopy (CLSM) images of HL‐1 cells coincubated with the ICG NBs or IMTP/ICG NBs for 2 h. Cell nuclei were stained with 4′,6‐diamidino‐2‐phenylindole (DAPI, blue), the cytoskeleton was stained by phalloidin (green), and NBs appeared red (scale bar = 20 µm). B) Results of quantitative CLSM image analysis were obtained using the image J software (*** p < 0.0001). n = 5. C) Results of the flow cytometry analysis of HL‐1 single cell suspensions after incubation without (left) and with the IMTP/ICG NBs (right). Data were presented as mean value ± the standard error of the mean (SEM). One‐way ANOVA was used for multiple comparisons. Significance levels are indicated as **** p < 0.0001.
Figure 3
Figure 3
Ex vivo fluorescence imaging and targeting efficiency and biodistribution of IMTP/ICG NBs. A) Ex vivo fluorescence images of the hearts from different groups were obtained at various times after the intravenous administration of the IMTP/ICG NBs or ICG NBs and B) results of the corresponding quantitative analysis. C) Fluorescence images showing the distribution of the IMTP/ICG NBs in the major organs (liver, spleen, lung, and kidney) at different times after the intravenous administration of these NBs and D) results of the corresponding quantitative analysis. n = 3. Data were presented as mean value ± the standard error of the mean (SEM). Two‐way ANOVA was used to analyze grouped analysis. Significance levels are indicated as * p < 0.05, and *** p < 0.001.
Figure 4
Figure 4
In vivo ultrasound molecular imaging. A–C) Contrast‐enhanced ultrasound (CEUS) mode was obtained at various times after the intravenous administration of IMTP/ICG NBs or ICG NBs (scale bar = 2 mm). D) Results of the quantitative analysis of the hearts in different groups at various times postinjection in CEUS mode. E–G) Echo intensity–time plots obtained for the hearts in different groups. n = 3. Data were presented as mean value ± the standard error of the mean (SEM). Two‐way ANOVA was used to analyze grouped analysis. Significance levels are indicated as * p < 0.05, and *** p < 0.001.
Figure 5
Figure 5
In vivo Photoacoustic imaging. A–C) Photoacoustic (PA) images of hearts in the three groups at different times after the intravenous administration of the IMTP/ICG NBs or ICG NBs (scale bar = 2 mm) and D) the results of the corresponding quantitative analysis. E) Ultrasound (US), oxygen saturation (sO2), and merged images were obtained for the sham and CMD groups (scale bar = 2 mm), and F) the results of the corresponding quantitative analysis. n = 3. Data were presented as mean value ± the standard error of the mean (SEM). Statistical analyses included two‐way ANOVA for grouped analysis and t‐test for two‐group comparisons. Significance levels are indicated as * p < 0.05, and ** p < 0.01.
Figure 6
Figure 6
Biosafety Evaluation of IMTP/ICG NBs. A,B) Hemolysis rates of red blood cells incubated with different concentrations of the IMTP/ICG NBs. C) Weight changes in mice were observed 14 days after the intravenous injection of saline or the IMTP/ICG NBs. n = 3. D,E) Results of routine blood tests performed 24 h after the intravenous injection of the IMTP/ICG NBs. n = 3. F–K) Blood biochemical indices, including alanine aminotransferase (ALT), aspartate aminotransferase (AST), creatinine (CREA), lactate dehydrogenase (LDH), total bilirubin (TBIL), and blood urea nitrogen (BUN) for control and IMTP/ICG NBs groups 14 days after intravenous injection of saline or IMTP/ICG NBs. n = 3. L) Results of the hematoxylin and eosin (HE) staining of major organs (heart, liver, spleen, lung, and kidney) from saline and IMTP/ICG NBs groups (scale bar = 50 µm).
Figure 7
Figure 7
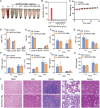
Treatment effect of TA/IMTP/ICG NBs. A) Cumulative release rate of TA/IMTP/ICG NBs as a function of time. Effects of TA/IMTP/ICG NBs and other treatments on B) heart weight, C) heart/body weight ratio, D) spleen index, E) plasma levels of creatine kinase (CK), F) malondialdehyde (MDA) concentrations and G) superoxide dismutase (SOD) activity in cardiac tissue, and heart tissue concentrations of H) catalase (CAT), I) glutathione peroxidase (GSH‐px), J) total glutathione (T‐GSH), K) glutathione (GSH). L) Results of the general toxicity evaluation of the TA/IMTP/ICG NBs. n = 5. Data were presented as mean value ± the standard error of the mean (SEM). One‐way ANOVA was used for multiple comparisons. Significance levels are indicated as * p < 0.05, ** p < 0.01, *** p < 0.001, and **** p < 0.0001.
Figure 8
Figure 8
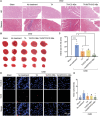
The ability of TA/IMTP/ICG NBs to improve ischemia and fibrosis in CMD mice. Results of A) hematoxylin and eosin (HE) and Masson's trichrome (scale bar = 100 µm) and B) triphenyl tetrazolium chloride (TTC) staining. C) Sizes of infarcted cardiac tissue in different groups. n = 3. D,E) Results of terminal deoxynucleotidyl transferase‐mediated dUTP nick end labeling (TUNEL) staining (scale bar = 100 µm) and (E) quantification. n = 3. Data were presented as mean value ± the standard error of the mean (SEM). One‐way ANOVA was used for multiple comparisons. Significance levels are indicated as ** p < 0.01, and *** p < 0.001.
Figure 9
Figure 9
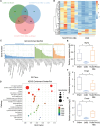
Transcriptomic analysis. A) Venn diagram revealing differentially expressed genes among the sham, CMD, and TA/IMTP/ICG NBs groups. B) Heatmap visually representing differentially expressed genes in the TA/IMTP/ICG NBs group versus the CMD group. Results of C) gene ontology (GO) functional enrichment analysis and D) Kyoto encyclopedia of genes and genomes (KEGG) pathway enrichment analysis performed on differentially expressed genes in the TA/IMTP/ICG NBs group versus the CMD group. Effects of the TA/IMTP/ICG NBs treatment on the expression of E) Atp7a, F) Ecrg4, and G) Fmod. n = 5. Data were presented as mean value ± the standard error of the mean (SEM). One‐way ANOVA was used for multiple comparisons. Significance levels are indicated as * p < 0.05.
Figure 10
Figure 10
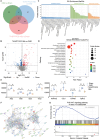
Proteomic analysis. A) Venn diagram and B) volcano plot illustrating the upregulated and downregulated proteins in different groups. Results of C) gene ontology (GO) functional enrichment analysis and D) Kyoto Encyclopedia of Genes and Genomes (KEGG) pathway enrichment analysis. E) Effects of the TA/IMTP/ICG NBs treatment on the levels of different proteins. F) Results of protein–protein interaction network analysis. G) Results of gene set enrichment analysis (GSEA) conducted on the pathways related to the differential proteins. n = 5. Data were presented as mean value ± the standard error of the mean (SEM). One‐way ANOVA was used for multiple comparisons. Significance levels are indicated as * p < 0.05, ** p < 0.01, and *** p < 0.001.

Similar articles

Cited by

References

    1. Del Buono M. G., Montone R. A., Camilli M., Carbone S., Narula J., Lavie C. J., Niccoli G., Crea F., J. Am. Coll. Cardiol. 2021, 78, 1352. - PMC - PubMed
    1. Kaski J. C., Crea F., Gersh B. J., Camici P. G., Circulation 2018, 138, 1463. - PubMed
    1. Kopeva K., Grakova E., Maltseva A., Mochula A., Gusakova A., Smorgon A., Zavadovsky K., J. Clin. Med. 2023, 12, 2964. - PMC - PubMed
    1. Shimokawa H., Suda A., Takahashi J., Berry C., Camici P. G., Crea F., Escaned J., Ford T., Yii E., Kaski J. C., Kiyooka T., Mehta P. K., Ong P., Ozaki Y., Pepine C., Rimoldi O., Safdar B., Sechtem U., Tsujita K., Yasuda S., Beltrame J. F., Merz C. N. B., Eur. Heart J. 2021, 42, 4592. - PMC - PubMed
    1. Crea F., Eur. Heart J. 2023, 44, 73. - PubMed