. 2025 Jan;31(1):e70037.
doi: 10.1111/gcb.70037.

Persistent Effects of Landscape Context on Recruitment Dynamics During Secondary Succession of Tropical Forests

Affiliations

Persistent Effects of Landscape Context on Recruitment Dynamics During Secondary Succession of Tropical Forests

Michiel van Breugel et al. Glob Chang Biol. 2025 Jan.

Abstract

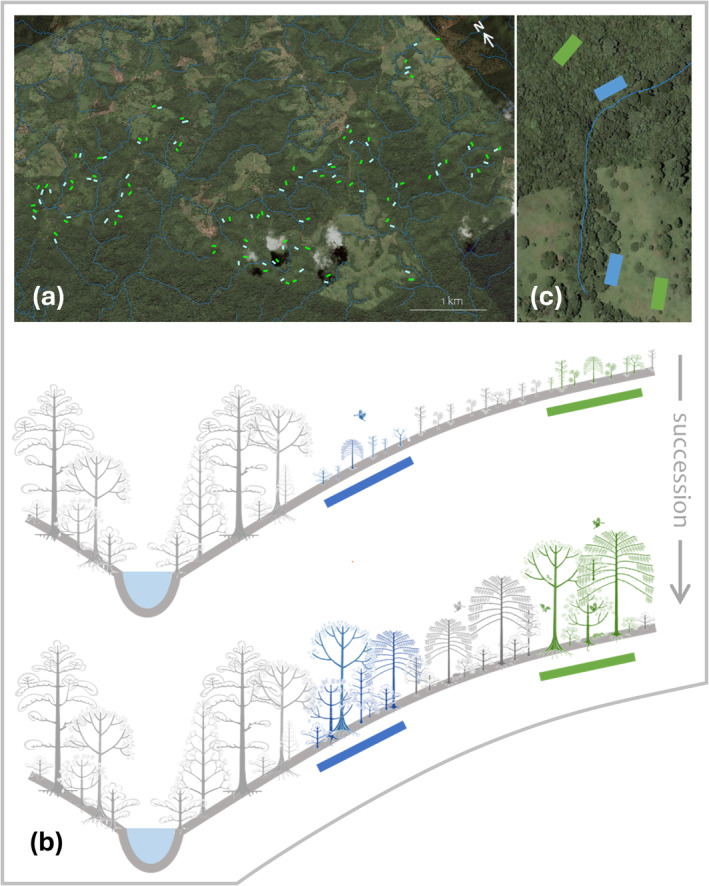
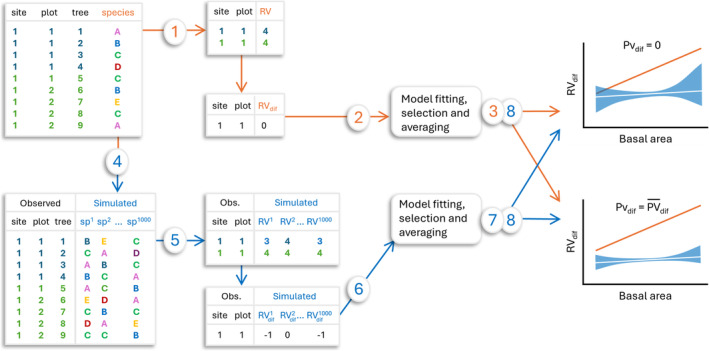
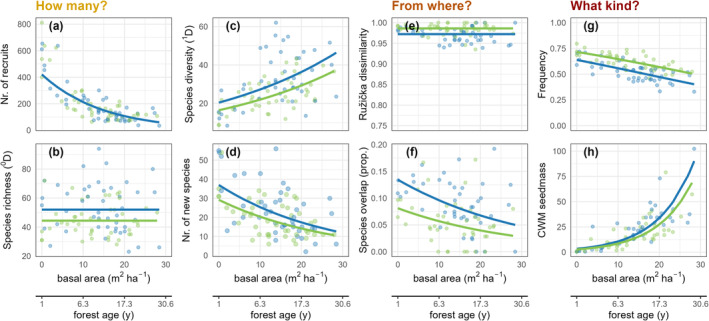
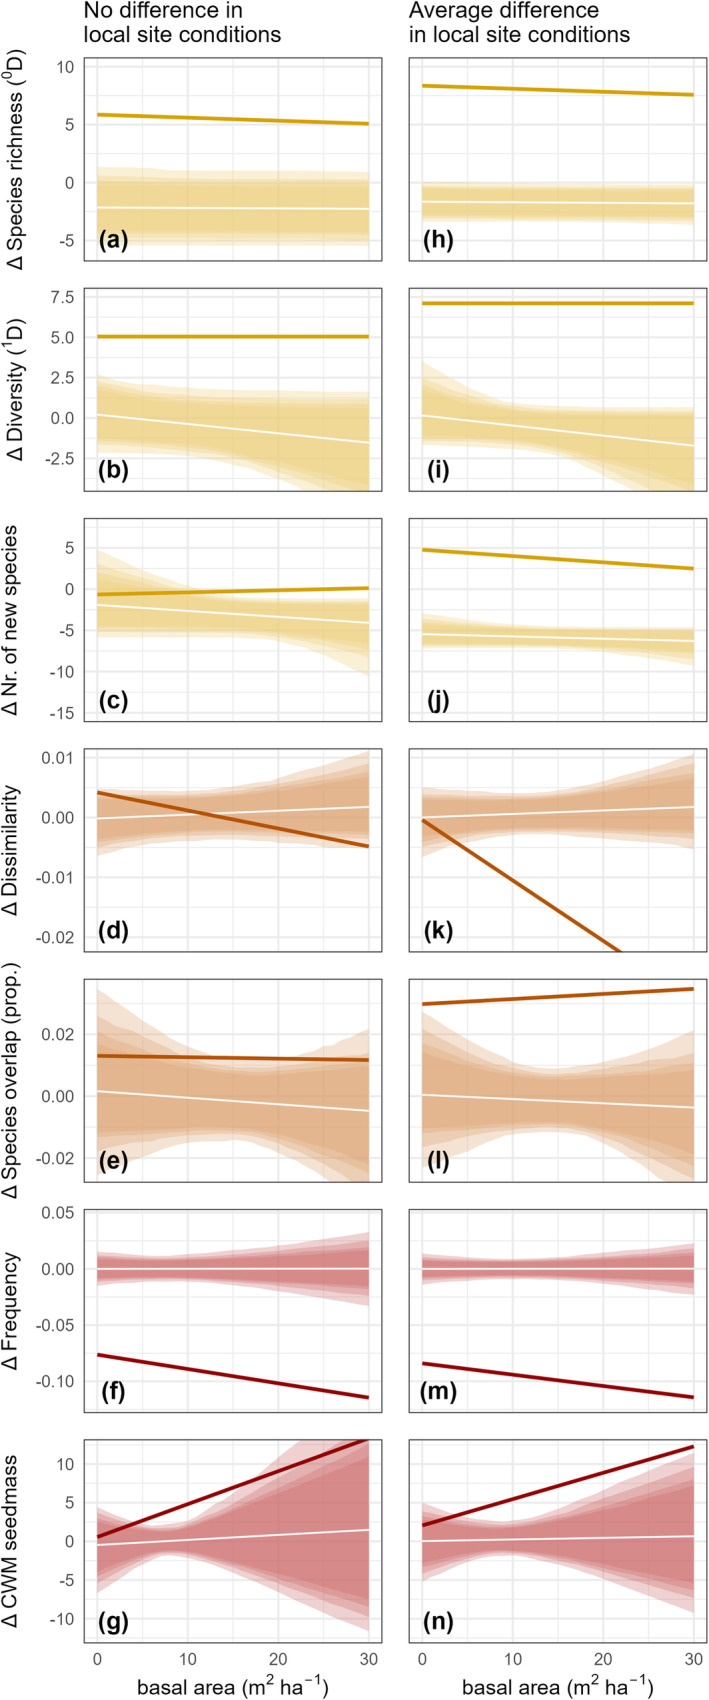
Large-scale reforestation is promoted as an important strategy to mitigate climate change and biodiversity loss. A persistent challenge for efforts to restore ecosystems at scale is how to accelerate ecological processes, particularly natural regeneration. Yet, despite being recognized as an important barrier to the recovery of diverse plant communities in tropical agricultural landscapes, the impacts of dispersal limitation on natural regeneration in secondary forests-and especially how this changes as these forests grow older-are still poorly studied. In a region where animals have been shown to be the dominant seed dispersers, we evaluate the impacts of proximity to a connected network of narrow streamside strips of forest (SSF) on recruitment in 1-40-year-old secondary forests. We used 8 years of annual census data from 45 sites with paired plots, one directly adjoining an SSF and the other further uphill (henceforth "landscape context"), and a null model approach to test the effects of proximity to SSFs and basal area, while accounting for variation in soil, topography, and distance between plots and stand structure. In general, we found that landscape context affects multiple aspects of recruitment, including species diversity and the proportion of rarer and less-widely distributed species among the recruits. Unexpectedly, this effect did not weaken over time, despite a fast increase in stand basal area and diversity. This suggests that forest development over the first decades of succession may not be sufficient to attract the animals that disperse rarer tree species. Our results provide empirical evidence to guide restoration initiatives in agricultural landscapes in tropical regions, principally prioritizing the restoration of forest corridor networks along streams, while also highlighting the knowledge gap about restoring animal dispersers in secondary forests.

Keywords: dispersal corridors; ecological succession; forest fragments; forest restoration; natural regeneration; recruitment dynamics; secondary forest; seed limitation.


Conflict of interest statement

The authors declare no conflicts of interests.

Figures

FIGURE 1
FIGURE 1
Study design of the Agua Salud Secondary Forest Dynamics study in central Panama. (a) Distribution of secondary forest plots. A total of 54 sites were selected in 49 0‐ to 32‐year‐old forests and 5 > 50‐year‐old forests. In each site, one 10 × 50 m plot was established at the lower end of the hill slope, adjacent to the streamside strip of the secondary forest that was present pre‐abandonment (blue) and one plot at the upper section of the hill slope (green). Distance between plots was 23–149 m (mean ± sd: 83 ± 25 m). The satellite image is from July 2011, 2 years after the start of the study. The contiguous forest at the bottom of the photo is Soberania National Park. (b, c) At the onset of succession, the far plot (FP) is more isolated, with no direct connectivity to the larger network of narrow strips of forest that local landowners in the study area generally leave along streams that border or cross their pastures and fields. In contrast, forest regrowth creates continuous forest cover along the slope later in succession. (c) For illustrative purposes only, rectangles are to scale but do not represent real plot locations.
FIGURE 2
FIGURE 2
The steps of the main analysis. (1) Calculate the six recruitment variables (RVs) and within‐site differences in recruitment variables (RVdif). (2) Fit full model and submodels, rank and select models based on AIC and average the model coefficients of the selected models. (3) Calculate predictions for stand basal areas of 0–30 m2 ha−1, with predictor variables set at either zero or their across‐site means. (4) Create two Null models by simulating data: reshuffle species within sites (depicted) or randomly assign species identities to trees, sampled with replacement from the study's full species list, weighted by species frequencies of occurrence in study plots. (5–7) Repeat steps 1–3 for each of the simulated datasets. (8) Compute confidence intervals and plot with predictions based on observed data. The steps are described in more detail in Section 2.5.
FIGURE 3
FIGURE 3
Spatial–temporal variation in recruitment along a successional gradient. Recruitment variables versus forest basal area and topographic position, with blue and green dots and lines representing lower and far plots, respectively. The trend lines are fitted to illustrate successional trends in recruitment dynamics. (a) RV1: Number of recruited individuals. (b) RV2: Number of recruited species. (c) RV3: Diversity of recruitment (Hill number of order 1). (d) RV4: Number of newly recruited species. (e) RV5: Ružička dissimilarity between extant trees ≥ 20‐cm DBH in the SSF and recruitment. (f) RV6: The proportion of recruited tree species that were among the species (trees ≥ 20‐cm DBH) in the SSF. (g) RV7: Across‐species mean frequency, which gives the degree to which recruitment was dominated by tree species that are widely distributed across the study area (see Table 1 for more details). (h) RV8: Community‐weighted mean seed mass (g) of the recruits. The eight recruitment variables are numbered as in Table 1.
FIGURE 4
FIGURE 4
Within‐site differences in recruitment. Predicted within‐site differences in recruitment variables between plots adjacent to and far from streamside secondary forests based on observed differences (darker lines) and predictions based on a null model (white lines with shaded areas representing 80%, 85%, 90%, and 95% percentile confidence intervals, respectively). The null model was built by permuting species identities within sites. Predictions are computed with within‐site differences in soil fertility, soil water content, topographic slope and forest basal area set at zero (right‐hand column) or at across‐site averages (left‐hand column). In both cases, the difference in distance to SSFs is set at the across‐site average. (a, b) RV2: Within‐site differences in number of recruited species (0D). (c, d) RV3: Within‐site differences in the diversity of recruitment (1D). (e, f) RV4: Within‐site differences in the number of newly recruited species. (g, h) RV5: Within‐site differences in Ružička dissimilarity between extant trees ≥ 20‐cm DBH in the SSF and the recruitment. (i, j) RV6: Within‐site differences in the proportion of recruited tree species that were among the species (trees ≥ 20‐cm DBH) in the SSF. (k, l) RV7: Within‐site differences in a cross‐species mean frequency, which gives the degree to which recruitment was dominated by tree species that are widely distributed across the study area (see Table 1 for more details). (m, n) RV8: Within‐site differences in community‐weighted mean seed mass (g) of the recruits.

Similar articles

Cited by

References

    1. Acevedo‐Charry, O. , and Aide T. M.. 2019. “Recovery of Amphibian, Reptile, Bird and Mammal Diversity During Secondary Forest Succession in the Tropics.” Oikos 128, no. 8: 1065–1078. 10.1111/oik.06252. - DOI
    1. Aide, T. M. , and Cavelier J.. 1994. “Barriers to Lowland Tropical Forest Restoration in the Sierra Nevada de Santa Marta, Colombia.” Restoration Ecology 2, no. 4: 219–229. 10.1111/j.1526-100X.1994.tb00054.x. - DOI
    1. Almond, G. , Bignoli D. J., and Petersen T., eds. 2022. Living Planet Report 2022 – Building a Nature‐ Positive Society. Gland, Switzerland: WWF. https://livingplanet.panda.org/en‐GB/.
    1. Alroy, J. 2017. “Effects of Habitat Disturbance on Tropical Forest Biodiversity.” Proceedings of the National Academy of Sciences 114, no. 23: 6056–6061. 10.1073/pnas.1611855114. - DOI - PMC - PubMed
    1. Anzures‐Dadda, A. , and Manson R. H.. 2007. “Patch‐ and Landscape‐Scale Effects on Howler Monkey Distribution and Abundance in Rainforest Fragments.” Animal Conservation 10, no. 1: 69–76. 10.1111/j.1469-1795.2006.00074.x. - DOI

LinkOut - more resources