

Reference Values for Water-Specific T1, Intermuscular and Intramuscular Fat Content in Skeletal Muscle at 2.89 T
- PMID: 39854265
- PMCID: PMC12179366
- DOI: 10.1002/jmri.29718
Reference Values for Water-Specific T1, Intermuscular and Intramuscular Fat Content in Skeletal Muscle at 2.89 T
Abstract
Background: MRI offers quantification of proton density fat fraction (PDFF) and tissue characteristics with T1 mapping. The influence of age, sex, and the potential confounding effects of fat on T1 values in skeletal muscle in healthy adults are insufficiently known.
Purpose: To determine the accuracy and repeatability of a saturation-recovery chemical-shift encoded multiparametric approach (SR-CSE) for quantification of T1Water and muscle fat content, and establish normative values (age, sex) from a healthy cohort.
Study type: Prospective observational; phantoms (NiCL2-agarose T1 phantoms with no fat content; gadolinium T1 phantoms with mixed fat-water content).
Populations: A total of 130 healthy community-dwelling adults (63 male, 18-76 years) free of chronic health conditions that require regular prescription medication, and with no contraindications to MRI.
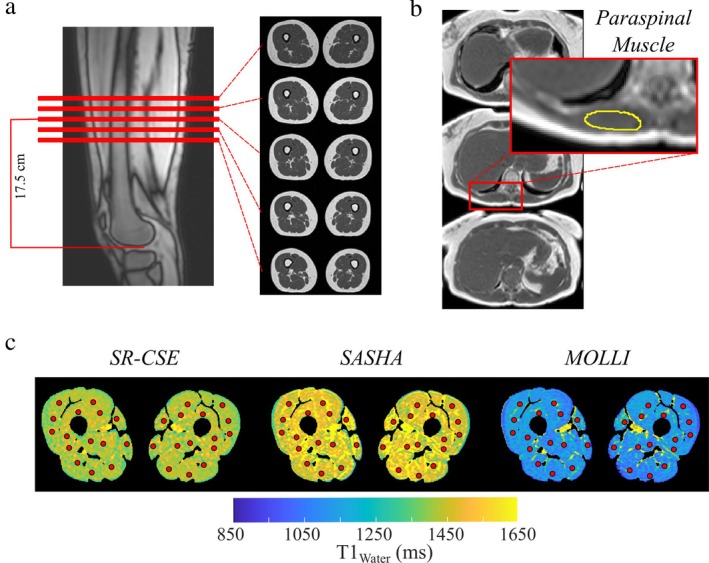
Field strength/sequence: 2.89 T; gradient echo sequences including saturation-recovery chemical-shift encoded T1 mapping (SR-CSE); MOLLI; SASHA; CSE; and single voxel spectroscopy.
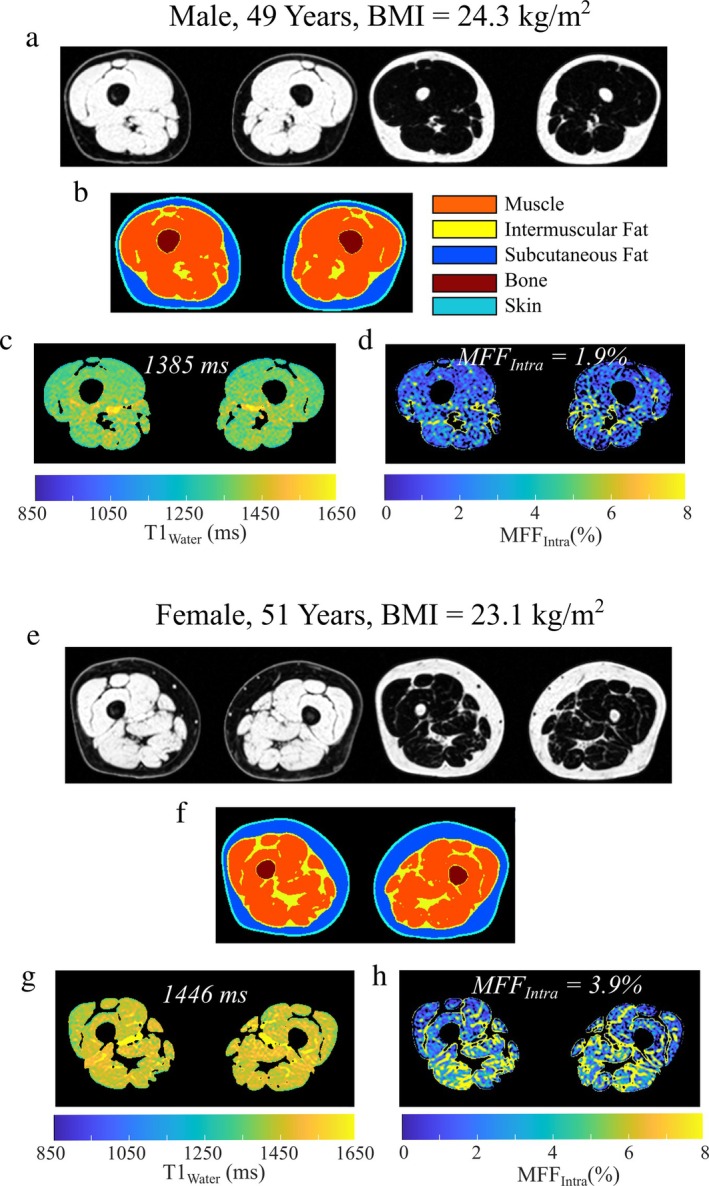
Assessment: SR-CSE provided T1Water and PDFF maps for assessment of intramuscular (MFIntra), intermuscular (MFInter), and subcutaneous fat and muscle volumes (thigh, paraspinal muscles). Comparison with MOLLI/SASHA T1 mapping.
Statistical tests: Univariable and multivariable linear regression, general linear models, Bland and Altman, coefficient of variation (CV). P-value <0.05 was considered statistically significant.
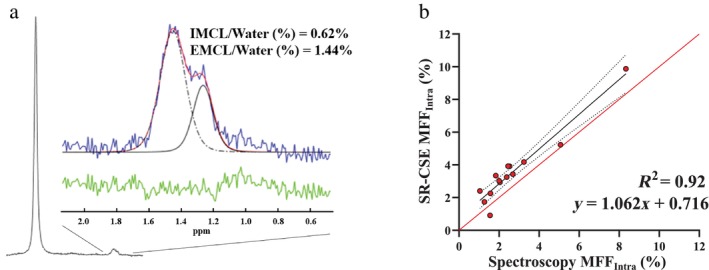
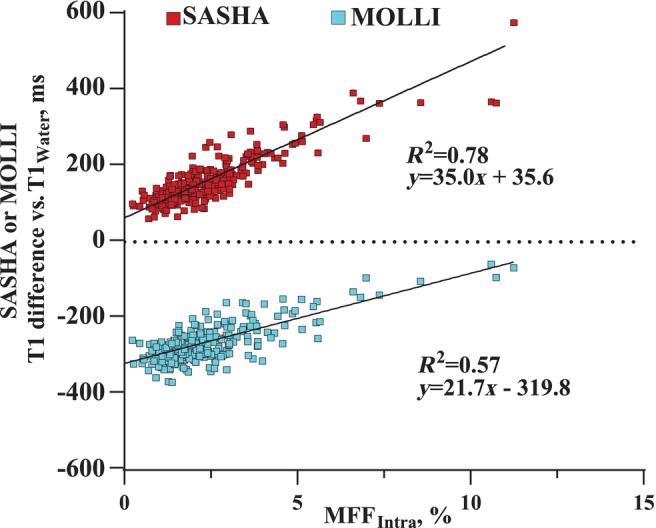
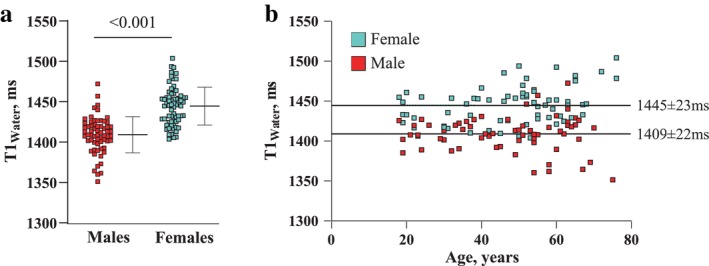
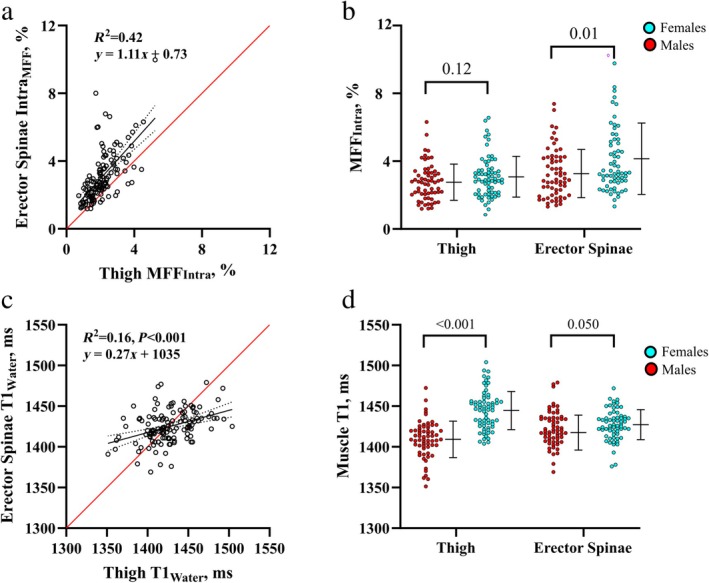
Results: Phantom and in vivo validation studies showed excellent accuracy of SR-CSE T1Water and PDFF vs. values from reference standards and repeatability CVs between 0.2% and 2.6% for T1Water, R2*, MFInter, MFIntra, subcutaneous fat and muscle volumes. Mean T1Water was 36 msec significantly higher in females (1445 ± 23 msec vs. 1409 ± 22 msec), with no age-effect (P = 0.35). Females had significantly higher values for MFInter (10.4% ± 4.8% vs. 7.1% ± 2.9%) and MFIntra (2.6% ± 1.0% vs. 2.3% ± 0.8%), both of which increased with age, secondary to lower muscle volume. MOLLI and SASHA T1 values had a fat-related bias of 21.7/35.0 msec per 1% increase in fat fraction (MFFIntra), in vivo, and a constant bias of -319.8/+35.6 msec, respectively.
Data conclusion: SR-CSE provides accurate (vs. phantoms) and repeatable assessment of water-specific T1 values and muscle and fat volumes. Conventional methods (SASHA, MOLLI) have a significant fat-modulated T1-bias. T1Water values are higher in females with no significant age dependence.
Plain language summary: We developed and tested the accuracy of a new MRI approach to measure tissue damage in skeletal muscle using a method called T1 mapping. The approach also provided matching images of fat within the muscle. We measured T1 values and muscle fat volumes in the thighs of 130 healthy adults to define normal values in healthy people and to understand if these values are influenced by age, sex, or weight. We found that our MRI technique accurately measured T1 values and fat volumes within muscle and we defined normal ranges of values, which were different in healthy males and females.
Level of evidence: 2 TECHNICAL EFFICACY: Stage 1.
Keywords: MOLLI; MRI; PDFF; SASHA; SR‐CSE; T1 mapping; skeletal muscle.
© 2025 The Author(s). Journal of Magnetic Resonance Imaging published by Wiley Periodicals LLC on behalf of International Society for Magnetic Resonance in Medicine.
Figures

Similar articles
-
Reference Values for Water-Specific T1 of the Liver at 3 T: T2*-Compensation and the Confounding Effects of Fat.J Magn Reson Imaging. 2024 Nov;60(5):2063-2075. doi: 10.1002/jmri.29262. Epub 2024 Feb 2. J Magn Reson Imaging. 2024. PMID: 38305588
-
Quantification of the Proton Density Fat Fraction and Iron Content: A Comparative Study Between 3.0 T and 5.0 T MRI.J Magn Reson Imaging. 2025 Aug;62(2):551-560. doi: 10.1002/jmri.29743. Epub 2025 Apr 10. J Magn Reson Imaging. 2025. PMID: 40208110
-
Multi-Center, Multi-Vendor Validation of Simultaneous MRI-Based Proton Density Fat Fraction and R2* Mapping Using a Combined Proton Density Fat Fraction-R2* Phantom.J Magn Reson Imaging. 2025 Sep;62(3):800-811. doi: 10.1002/jmri.29775. Epub 2025 Apr 18. J Magn Reson Imaging. 2025. PMID: 40251801 Free PMC article.
-
Signs and symptoms to determine if a patient presenting in primary care or hospital outpatient settings has COVID-19.Cochrane Database Syst Rev. 2022 May 20;5(5):CD013665. doi: 10.1002/14651858.CD013665.pub3. Cochrane Database Syst Rev. 2022. PMID: 35593186 Free PMC article.
-
Nutritional supplementation for stable chronic obstructive pulmonary disease.Cochrane Database Syst Rev. 2012 Dec 12;12(12):CD000998. doi: 10.1002/14651858.CD000998.pub3. Cochrane Database Syst Rev. 2012. PMID: 23235577 Free PMC article.
References
-
- Goodpaster BH, Bergman BC, Brennan AM, Sparks LM. Intermuscular adipose tissue in metabolic disease. Nat Rev Endocrinol 2023;19:285‐298. - PubMed
Publication types
MeSH terms
Substances
LinkOut - more resources
Full Text Sources
Medical
Research Materials
