Comparative Study
. 2025 Jan 24;20(1):e0317933.
doi: 10.1371/journal.pone.0317933. eCollection 2025.

Assessment of temporospatial and kinematic gait parameters using human pose estimation in patients with Parkinson's disease: A comparison between near-frontal and lateral views

Affiliations
Comparative Study

Assessment of temporospatial and kinematic gait parameters using human pose estimation in patients with Parkinson's disease: A comparison between near-frontal and lateral views

Jeongsik Kim et al. PLoS One. .

Abstract

Gait disturbance is one of the most common symptoms in patients with Parkinson's disease (PD) that is closely associated with poor clinical outcomes. Recently, video-based human pose estimation (HPE) technology has attracted attention as a cheaper and simpler method for performing gait analysis than marker-based 3D motion capture systems. However, it remains unclear whether video-based HPE is a feasible method for measuring temporospatial and kinematic gait parameters in patients with PD and how this function varies with camera position. In this study, treadmill and overground walking in 24 patients with early PD was measured using a motion capture system and two smartphone cameras placed on the near-frontal and lateral sides of the subjects. We compared the differences in temporospatial gait parameters and kinematic characteristics between joint position data obtained from the 3D motion capture system and the markerless HPE. Our results confirm the feasibility of analyzing gait in patients with PD using HPE. Although the near-frontal view, where the heel and toe are clearly visible, is effective for estimating temporal gait parameters, the lateral view is particularly well-suited for assessing spatial gait parameters and joint angles. However, in clinical settings where lateral recordings are not feasible, near-frontal view recordings can still serve as a practical alternative to motion capture systems.


Conflict of interest statement

The authors have declared that no competing interests exist.

Figures

Fig 1
Fig 1
(a) Lateral view of the subject’s gait during the experiment. (b) Near-frontal view of the subject’s gait during the experiment. (c) Experimental setup: The arrangement of the treadmill and cameras for recording gait, with arrows indicating the walking direction. (d) Whole-body marker set used for motion capture, as provided by Motive software.
Fig 2
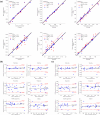
Fig 2. Comparison of temporal gait parameters between motion capture and pose estimation systems during treadmill walking.
(a) Linear regression plots comparing temporal gait parameters obtained from motion capture (Mocap) with those from near-frontal and lateral video-based pose estimation (HPEF and HPEL). Red dots represent comparisons between Mocap and near-frontal HPEF, while blue dots represent comparisons between Mocap and lateral HPEL. The black line indicates the identity line, and the red and blue lines show the linear regression lines for HPEF and HPEL respectively. (b) Bland-Altman plots comparing temporal gait parameters between Mocap and HPEF. (c) Bland-Altman plots comparing Mocap and HPEL. The black line in (b) and (c) represents the mean difference between the two methods, while the red dashed lines indicate the limits of agreement (±1.96 standard deviations). Blue dots in (b) and (c) represent the error distribution for the corresponding comparisons.
Fig 3
Fig 3. Comparison of temporal gait parameters between motion capture and pose estimation systems during backward overground walking.
(a) Linear regression plots comparing temporal gait parameters obtained from motion capture (Mocap) with those from near-frontal and lateral video-based pose estimation (HPEF and HPEL). Red dots represent comparisons between Mocap and near-frontal HPEF, while blue dots represent comparisons between Mocap and lateral HPEL. The black line indicates the identity line, and the red and blue lines show the linear regression lines for HPEF and HPEL respectively. (b) Bland-Altman plots comparing temporal gait parameters between Mocap and HPEF. (c) Bland-Altman plots comparing Mocap and HPEL. The black line in (b) and (c) represents the mean difference between the two methods, while the red dashed lines indicate the limits of agreement (±1.96 standard deviations). Blue dots in (b) and (c) represent the error distribution for the corresponding comparisons.
Fig 4
Fig 4. Comparison of temporal gait parameters between motion capture and pose estimation systems during forward overground walking.
(a) Linear regression plots comparing temporal gait parameters obtained from motion capture (Mocap) with those from near-frontal and lateral video-based pose estimation (HPEF and HPEL). Red dots represent comparisons between Mocap and near-frontal HPEF, while blue dots represent comparisons between Mocap and lateral HPEL. The black line indicates the identity line, and the red and blue lines show the linear regression lines for HPEF and HPEL respectively. (b) Bland-Altman plots comparing temporal gait parameters between Mocap and HPEF. (c) Bland-Altman plots comparing Mocap and HPEL. The black line in (b) and (c) represents the mean difference between the two methods, while the red dashed lines indicate the limits of agreement (±1.96 standard deviations). Blue dots in (b) and (c) represent the error distribution for the corresponding comparisons.
Fig 5
Fig 5. Sagittal plane joint angle analysis of the hip, knee, and ankle during overground and treadmill walking.
The graphs compare joint angle trajectories for different conditions: (a) Forward walking overground, (b) Backward walking overground, (c) Treadmill walking. The solid red lines represent the mean joint angles of HPEL. The blue dashed line represents joint angle from Mocap. The shaded areas indicate the standard deviation across gait cycles.

References

    1. Galna B., et al.., Progression of gait dysfunction in incident Parkinson’s disease: impact of medication and phenotype. Mov Disord, 2015. 30(3): p. 359–67. doi: 10.1002/mds.26110 - DOI - PubMed
    1. Del Din S., et al.., Gait analysis with wearables predicts conversion to parkinson disease. Ann Neurol, 2019. 86(3): p. 357–367. doi: 10.1002/ana.25548 - DOI - PMC - PubMed
    1. Bonacina D., et al.., Spatiotemporal, kinematic and kinetic gait characteristics in Parkinson’s disease compared to healthy individuals: A systematic review with meta-analysis. Clinical Biomechanics, 2024. 120: p. 106359. doi: 10.1016/j.clinbiomech.2024.106359 - DOI - PubMed
    1. Mirelman A., et al.., Gait impairments in Parkinson’s disease. Lancet Neurol, 2019. 18(7): p. 697–708. doi: 10.1016/S1474-4422(19)30044-4 - DOI - PubMed
    1. Bloem B.R., et al.., Measurement instruments to assess posture, gait, and balance in P arkinson’s disease: Critique and recommendations. Movement Disorders, 2016. 31(9): p. 1342–1355. doi: 10.1002/mds.26572 - DOI - PubMed

Publication types