. 2025 Jan 24;20(1):e0317568.
doi: 10.1371/journal.pone.0317568. eCollection 2025.

Activation of S1PR2 on macrophages and the hepatocyte S1PR2/RhoA/ROCK1/MLC2 pathway in vanishing bile duct syndrome

Affiliations

Activation of S1PR2 on macrophages and the hepatocyte S1PR2/RhoA/ROCK1/MLC2 pathway in vanishing bile duct syndrome

Aya Miyagawa-Hayashino et al. PLoS One. .

Abstract

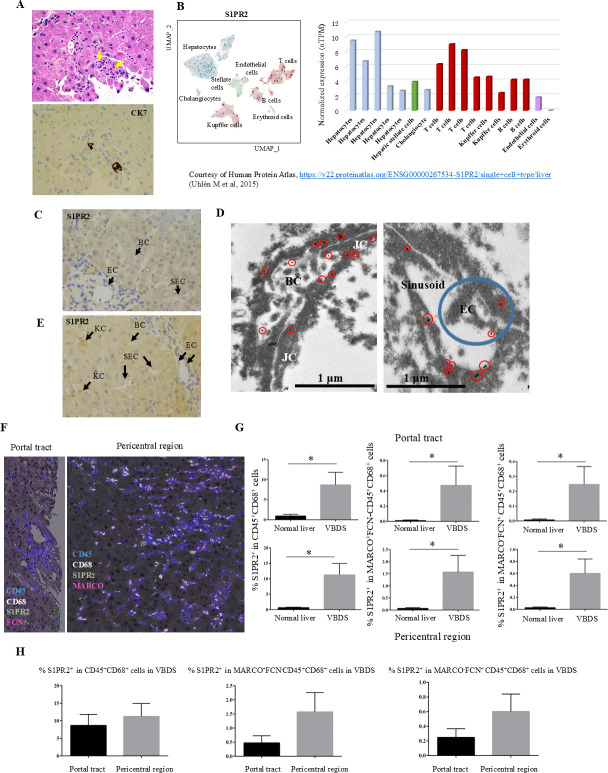
Immunologic bile duct destruction is a pathogenic condition associated with vanishing bile duct syndrome (VBDS) after liver transplantation and hematopoietic stem-cell transplantation. As the bile acid receptor sphingosine 1-phosphate receptor 2 (S1PR2) plays a critical role in recruitment of bone marrow-derived monocytes/macrophages to sites of cholestatic liver injury, S1PR2 expression was examined using cultured macrophages and patient tissues. Bile canaliculi destruction precedes intrahepatic ductopenia; therefore, we focused on hepatocyte S1PR2 and the downstream RhoA/Rho kinase 1 (ROCK1) signaling pathway and bile canaliculi alterations using three-dimensional hepatocyte culture models that form obvious bile canaliculus-like networks. Multiplex immunohistochemistry revealed increased numbers of S1PR2+CD45+CD68+FCN1+ inflammatory macrophages and S1PR2+CD45+CD68+MARCO+ Kupffer cells in liver tissues showing ductopenia due to graft-versus-host disease and rejection post-liver transplant compared with normal liver. Macrophage expression of proinflammatory cytokines, including MCP1, was reduced following S1PR2 inhibition. Taurocholic acid and S1P2 agonist induced hepatocyte S1PR2 and reduced RhoA/ROCK1 expression, resulting in bile canaliculi dilatation. S1PR2 inhibition reversed the effect on RhoA/ROCK1 expression, resulting in maintenance of bile canaliculi through myosin light chain 2 (MLC2) phosphorylation. Activation of S1PR2 on macrophages and S1PR2 on hepatocytes may disrupt bile canaliculi dynamics in VBDS under regulation by RhoA/ROCK1 through MLC2 phosphorylation.


Conflict of interest statement

SS, MH, and HO are employees of SCREEN Holdings Co., Ltd. This does not alter our adherence to PLOS ONE policies on sharing data and materials. The other authors have declared that no competing interests exist.

Figures

Fig 1
Fig 1. S1PR2 and its downstream molecules, RhoA/ROCK1/myosin light chain 2, in regulating bile canaliculi dynamics.
A schematic figure of bile canaliculi (BC) alterations resulting in constriction or dilatation of the canalicular lumen following changes in RhoA/ROCK1/myosin light chain 2 (MLC2) phosphorylation; activation of ROCK1 maintains MLC2 phosphorylation, leading to BC constriction through actin–myosin interaction. Activation of S1PR2 may inhibit ROCK1 activity and cause MLC2 dephosphorylation, leading to BC dilatation.
Fig 2
Fig 2. S1PR2 expression in normal liver tissue and vanishing bile duct syndrome (VBDS) and immune characterization of liver macrophages using multiplex immunohistochemistry.
(A) Hematoxylin and eosin staining (upper) and CK7 immunohistochemistry analysis (lower) in VBDS associated with graft-versus-host disease (GVHD) after hematopoietic stem cell transplantation. Immunostaining for CK7 highlights atrophy and the paucity of intrahepatic bile ducts (arrows) in the portal tact. (B) Analysis of a single-cell RNA sequencing dataset retrieved from published studies based on healthy human liver tissues revealed that single-cell RNA levels of S1PR2 in hepatocyte clusters were higher than those in other cell type groups. Note the lower RNA expression in Kupffer cells in normal liver compared with hepatocytes. To the left, a UMAP plot illustrates the RNA expression profile of each cell type group. The bar chart to the right shows nTPM levels in each annotated cluster of single cells. Courtesy of Human Protein Atlas, https://v22.proteinatlas.org/ENSG00000267534-S1PR2/single+cell+type/liver (Uhlén et al., 2015). (C) In normal human liver, endothelial cells (ECs) in the portal vein were positive for S1PR2, but no staining was seen in sinusoidal endothelial cells (SEC) or bile canaliculi (BC) by immunohistochemistry (original magnification, ×200). (D) Immunoelectron microscopy revealed the binding sites of S1PR2 around bile canaliculi and sinusoids. BC, bile canaliculi; EC, endothelial cell; JC, junctional complex. Red circles indicate gold particles and blue circles endothelial cells. (E) In a case of GVHD showing VBDS, positive S1PR2 staining was observed in endothelial cells (ECs) in the portal vein and sinusoidal endothelial cells (SEC), bile canaliculi (BC), and Kupffer cells (KC) in the sinusoid, and faint staining was observed in hepatocyte cytoplasm. (F) Left image shows hematoxylin and multiplex staining of S1PR2+ cells in CD45+CD68+FCN1+MARCO− inflammatory macrophages in the portal tract in a case of chronic rejection showing vanishing bile ducts after liver transplantation. Note the paucity of bile ducts. Right image shows hematoxylin and multiplex staining of S1PR2+ cells in CD45+CD68+FCN−MARCO+ Kupffer cells in the pericentral region in a case of antibody-mediated rejection showing vanishing bile ducts after liver transplantation. (G) The percentage S1PR2+ cells among CD45+/CD68+ cells was increased in VBDS compared with normal liver. Liver macrophage populations including CD45+CD68+FCN1+MARCO− inflammatory macrophages and CD45+CD68+FCN1−MARCO+ immunoregulatory macrophages both showed increased S1PR2 expression in the portal tract and pericentral region of lobules in VBDS compared with normal liver. *P<0.05 by unpaired t-test. (H) The percentage of S1PR2-expressing macrophages showed an increasing trend in both in FCN-positive and MARCO-positive macrophages in the pericentral region of the liver compared with the portal tracts in VBDS, but the difference was not statistically significant.
Fig 3
Fig 3. S1PR2 inhibition reduces the levels of proinflammatory cytokines, including MCP1 in LPS- and S1P2-stimulated macrophages.
(A) THP-1 cells were induced to differentiate into macrophages by PMA treatment and showed increased expression of S1PR2. Treatment with an S1P2 agonist (CYM5520) upregulated mRNA expression levels of S1PR2 and MCP1 in macrophages, and S1PR2 knockdown significantly inhibited the expression of S1PR2 and MCP1 compared with macrophages treated with scrambled siRNA. (B) Macrophages were analyzed by flow cytometry for the expression of S1PR2 with S1P2 agonist. Representative histogram of S1PR2 expression with S1P2 agonist (pink line); JTE-013 inhibited expression (blue line). Black line represents the isotype control. One representative result of three is shown. (C) ELISA showing that supernatant levels of S1P2-induced MCP1 were significantly reduced by S1PR2 knockdown in macrophages. (D) The expression of S1PR2 mRNA was significantly elevated on PMA-induced differentiated macrophages stimulated with LPS. S1PR2 siRNA treatment effectively silenced the corresponding target gene by 70%, as assessed by qPCR. (E) ELISA showing that supernatant levels of proinflammatory cytokines, including MCP1, TNF-α, and IL-6, were increased in macrophages stimulated with LPS. S1PR2 knockdown significantly blocked the production of these cytokines by macrophages. *P<0.05 by one-way ANOVA, Tukey test in (A),*P<0.05 by unpaired t-test in (C-E). Results are the mean ± SEM of triplicate experiments.
Fig 4
Fig 4. Treatment with TCA and S1P2 agonist leads to bile canaliculi dilatation, and inhibition of S1PR2 expression reverses the change in the size of the bile canaliculi lumen; inhibition of S1PR2 expression increases MLC2 phosphorylation.
(A) Well-formed bile canaliculus–like networks generated using a novel culture method with collagen vitrigel membrane (CVM) chambers (arrowheads). Canalicular transporters, multidrug resistance–related protein 2 (MRP2/ABCC2), and bile salt export pump (BSEP/ABC11) are distributed on the canalicular membranes (arrows). (B) Effects of TCA and S1P2 on bile canaliculi with or without inhibitors (JTE-013 or Y27632). Bile canaliculi are highlighted red by pericanalicular F-actin (arrows). For comparison, bile canaliculi constriction resulting from treatment with cyclosporine A (CyA) (50 μM) for 24 h is shown. TCA and S1P2 exposure led to bile canaliculi dilatation, in contrast to the control. JTE-013 negated the effect of TCA- or S1P2-induced dilatation of the bile canaliculi lumen. In the presence of Y27632, TCA or S1P2 induced strong dilatation of bile canaliculi. (C) Quantification of the bile canaliculi area with various compounds tested using CVM chambers. Exposure to CyA resulted in constriction of the bile canaliculi lumen, and treatment with TCA or S1P2 resulted in dilatation of the bile canaliculi lumen. TCA exposure following pretreatment with the selective S1PR2 antagonist JTE-013 for 1 h reduced bile canaliculi dilatation. S1P2 exposure following pretreatment with JTE-013 for 1 h restored the normal bile canaliculi area. The bile canaliculi lumen was significantly dilated with TCA or S1P2 exposure following pretreatment with Y27632. (D) ELISA showed that MLC2 phosphorylation increased following treatment with the constrictor, CyA, and inhibition of S1PR2 increased the level of phosphorylated MLC2 under the condition of CyA treatment. *P<0.05 by one-way ANOVA, Tukey’s test.
Fig 5
Fig 5. Treatment with TCA and S1P2 agonist induces S1PR2 expression and attenuates ROCK1/RHOA expression; inhibition of S1PR2 reverses TCA- or S1P2-mediated effect on ROCK1/RHOA expression in HepG2-NIAS cells.
(A) Induction of S1PR2 mRNA expression by TCA treatment was transient, reaching a maximum at 8 h and returning to the basal level 24 h after treatment in HepG2-NIAS cells. (B) Induction of S1PR2 mRNA expression following 24-h treatment of HepG2-NIAS cells with S1P2 agonist. (C) S1PR2 mRNA expression was significantly increased with TCA or S1P2 agonist stimulation as compared with the control and significantly reduced after pretreatment with JTE-013, an antagonist of S1PR2. (D) TCA or S1P2 agonist administration attenuated ROCK1 mRNA expression. Pretreatment with JTE-013 reversed the TCA- or S1P2-mediated decrease in ROCK1 expression. (E) RHOA mRNA expression exhibited a tendency similar to that of ROCK1. (F) Western blotting analysis of RhoA, ROCK1, and S1PR2 expression in HepG2-NIAS cells treated with TCA or S1P2 agonist with or without pretreatment with JTE-013. TCA- or S1P2-mediated S1PR2 expression was suppressed following pretreatment with JTE-013. The changes in protein levels of RhoA and ROCK1 were not significant. *P<0.05 by one-way ANOVA, Dunnett’s multiple comparison test compared with DMSO control in (A) and (B). One-way ANOVA, Tukey’s test in (C), (D), and (E). Results are the mean ± SEM of triplicate experiments.

Similar articles

Cited by

References

    1. Basturk O, Volkan Adsay N. Bile duct diseases. In: Burt AD, Ferrell LD, Hubscher SG, editors. MacSween’s Pathology of the Liver. Amsterdam, Netherlands: Elsevier, Ltd.; 2024. pp.556–643.
    1. Clouston A, Hubscher S. Transplantation Pathology. In Burt AD, Ferrell LD, Hubscher SG, editors. MacSween’s Pathology of the Liver. Amsterdam, Netherlands: Elsevier, Ltd.; 2024. pp.947–1038.
    1. Padda MS, Sanchez M, Akhtar AJ, Boyer JL. Drug-induced cholestasis. Hepatology. 2011;53: 1377–1387. doi: 10.1002/hep.24229 - DOI - PMC - PubMed
    1. Ishii I, Ye X, Friedman B, Kawamura S, Contos JJ, Kingsbury MA, et al.. Marked perinatal lethality and cellular signaling deficits in mice null for the two sphingosine 1-phosphate (S1P) receptors, S1P(2)/LP(B2)/EDG-5 and S1P(3)/LP(B3)/EDG-3. J Biol Chem. 2002; 277: 25152–25159. doi: 10.1074/jbc.M200137200 - DOI - PubMed
    1. Sugimoto N, Takuwa N, Okamoto H, Sakurada S, Takuwa Y. Inhibitory and stimulatory regulation of Rac and cell motility by the G12/13-Rho and Gi pathways integrated downstream of a single G protein-coupled sphingosine-1-phosphate receptor isoform. Mol Cell Biol. 2003;23: 1534–1545. doi: 10.1128/MCB.23.5.1534-1545.2003 - DOI - PMC - PubMed