

Identification of hypertension gene expression biomarkers based on the DeepGCFS algorithm
- PMID: 39854379
- PMCID: PMC11761172
- DOI: 10.1371/journal.pone.0314319
Identification of hypertension gene expression biomarkers based on the DeepGCFS algorithm
Abstract
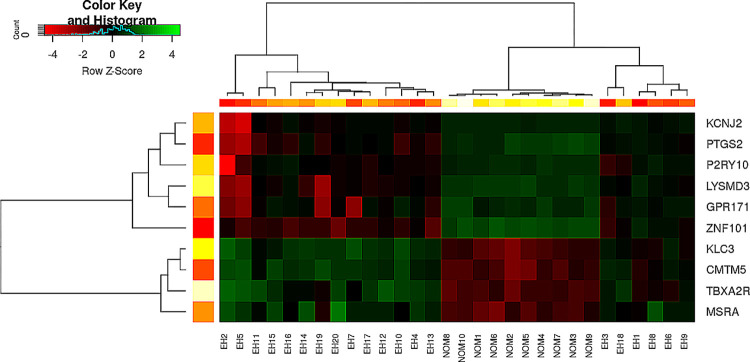
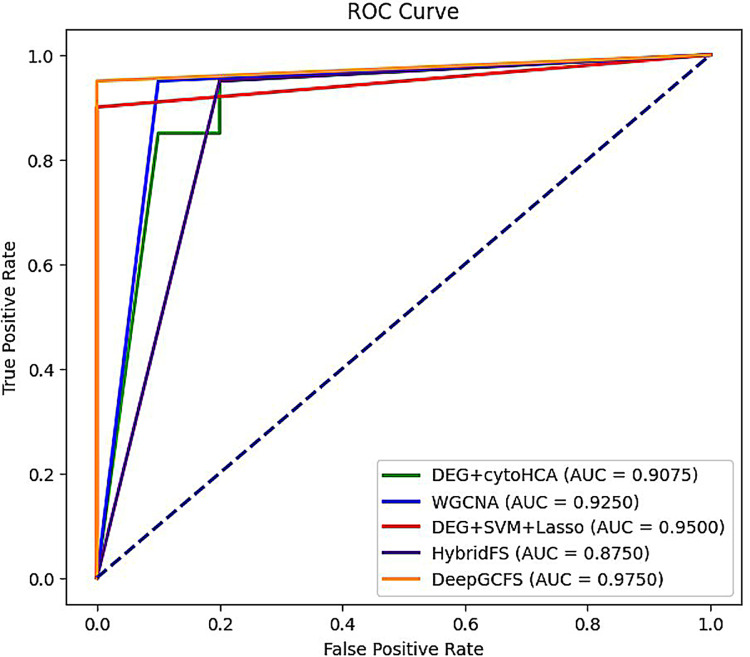
Hypertension is a critical risk factor and cause of mortality in cardiovascular diseases, and it remains a global public health issue. Therefore, understanding its mechanisms is essential for treating and preventing hypertension. Gene expression data is an important source for obtaining hypertension biomarkers. However, this data has a small sample size and high feature dimensionality, posing challenges to biomarker identification. We propose a novel deep graph clustering feature selection (DeepGCFS) algorithm to identify hypertension gene biomarkers with more biological significance. This algorithm utilizes a graph network to represent the interaction information between genes, builds a GNN model, designs a loss function based on link prediction and self-supervised learning ideas for training, and allows each gene node to obtain a feature vector representing global information. The algorithm then uses hybrid clustering methods for gene module detection. Finally, it combines integrated feature selection methods to determine the gene biomarkers. The experiment revealed that all the ten identified hypertension biomarkers were significantly differentiated, and it was found that the classification performance of AUC can reach 97.50%, which is better than other literature methods. Six genes (PTGS2, TBXA2R, ZNF101, KCNJ2, MSRA, and CMTM5) have been reported to be associated with hypertension. By using GSE113439 as the validation dataset, the AUC value of classification performance was to be 95.45%, and seven of the genes (LYSMD3, TBXA2R, KLC3, GPR171, PTGS2, MSRA, and CMTM5) were to be significantly different. In addition, this algorithm's performance of gene feature vector clustering was better than other comparative methods. Therefore, the proposed algorithm has significant advantages in selecting potential hypertension biomarkers.
Copyright: © 2025 Li et al. This is an open access article distributed under the terms of the Creative Commons Attribution License, which permits unrestricted use, distribution, and reproduction in any medium, provided the original author and source are credited.
Conflict of interest statement
The authors have declared that no competing interests exist.
Figures


References
-
- Krokstad S. Worldwide trends in hypertension prevalence and progress in treatment and control from 1990 to 2019: a pooled analysis of 1201 population-representative studies with 104 million participants (vol 398, pg 957, 2021). The Lancet. 2022;(10324): 399. doi: 10.1016/S0140-6736(21)01330-1 - DOI - PMC - PubMed
MeSH terms
Substances
LinkOut - more resources
Full Text Sources
Medical
Research Materials
