. 2025 Jan 24;11(4):eadp0855.
doi: 10.1126/sciadv.adp0855. Epub 2025 Jan 24.

Mature chromatin packing domains persist after RAD21 depletion in 3D

Affiliations

Mature chromatin packing domains persist after RAD21 depletion in 3D

Wing Shun Li et al. Sci Adv. .

Abstract

Understanding chromatin organization requires integrating measurements of genome connectivity and physical structure. It is well established that cohesin is essential for TAD and loop connectivity features in Hi-C, but the corresponding change in physical structure has not been studied using electron microscopy. Pairing chromatin scanning transmission electron tomography with multiomic analysis and single-molecule localization microscopy, we study the role of cohesin in regulating the conformationally defined chromatin nanoscopic packing domains. Our results indicate that packing domains are not physical manifestation of TADs. Using electron microscopy, we found that only 20% of packing domains are lost upon RAD21 depletion. The effect of RAD21 depletion is restricted to small, poorly packed (nascent) packing domains. In addition, we present evidence that cohesin-mediated loop extrusion generates nascent domains that undergo maturation through nucleosome posttranslational modifications. Our results demonstrate that a 3D genomic structure, composed of packing domains, is generated through cohesin activity and nucleosome modifications.


Figures

Fig. 1.
Fig. 1.. ChromSTEM preparation and tomogram analysis.
(A) High-resolution mean projection from ChromSTEM in HCT-116 cells. (B) Tomogram reconstruction showing distribution of high-density areas with surrounding porosity in a 100-nm section. (C) Visualized chromatin loop with an approximate length of 120 nm. (D) High resolution of packing domain tomogram projection (200 nm by 200 nm) showing high density within chromatin center with progressively decreasing intensity until porous regions are encountered (black). (E) Log-log plot of mass density distribution versus radius from the visualized packing domain demonstrating the emergence of three distinct chromatin regimens: yellow (disorder polymer), orange (power-law polymer), and red (territorial polymer). The transition between states occurs throughout the nucleus and varies between packing domains. A.U., arbitrary units.
Fig. 2.
Fig. 2.. Chromatin organizes into packing domains in HCT-116.
(A) Packing domains identified in ChromSTEM tomogram with projection of their centroid (white circle) and bounding radius (purple) in control cells. Scale bar, 100 nm. In total, 78 packing domains were identified within this tomogram. Packing domains are identified by local threshold detection, and the radius is determined by the minima of either the (i) radius deviates from log-log density, (ii) the radius that reaches the first derivative, or (iii) the radius at which the minimum density occurs. (B) Chromatin volume fraction decays from the center of packing domains toward their periphery, with the PD density approaching the average CVC of the nucleus near the periphery of the packing domains. Error bars represent median deviation. (C to E) Packing domains are heterogeneous structures with a distribution of sizes (C), CVC (D), and power-law packing (E).
Fig. 3.
Fig. 3.. RAD21 depletion results in expected loss of TADs, loops, and decreased insulation.
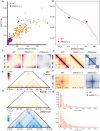
(A) Verification of RAD21 depletion by both quantification of mClover and RAD21-immunofluorescent staining showing that more than 90% of the population is without detectable RAD21. Axes representing corrected total fluorescence in arbitrary units. (B) Contact scaling is observed to decrease at short ranges and increase at long ranges upon RAD21 depletion. (C) Compartment insulation demonstrates compartment score weakening with RAD21 depletion. (D) TAD insulation plots demonstrating TAD insulation strength decreases with RAD21-depletion. (E) Representative loop domain anchor point on chromosome 14 showing that while the loop domain in control cells. (F) Observed weakening of loop anchors on the insulation plot. (G) Comparison of loop domain observed in (E) upon RAD21 depletion demonstrating a decrease in local contacts. (H) Quantification of TADs and loop domains observed in control versus RAD21(−) cells showing predominantly a loss of >95% of TADs and ~95% of loop domains at 6 hours of treatment with 1 μM 5-Ph-IAA. WT, wild type; FC, fold change.
Fig. 4.
Fig. 4.. Packing domain size and organization are minimally transformed upon RAD21 depletion.
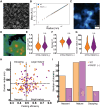
(A) ChromSTEM tomogram from RAD21 5-Ph-IAA–treated cells after 6 hours of depletion demonstrating remarkable similarity to chromatin DMSO control cells above. (B) Analysis of chromatin density distribution demonstrates minimal changes in chromatin organization across all three regimes. (C) Visualized chromatin loop in RAD21-depleted tomogram demonstrating the continued presence of long-range interactions despite loss of cohesin-mediated loop extrusion. (D) Representative packing domain (200 nm by 200 nm) from RAD21-depleted cells showing similar features to those within control cells with a high-density center and continuous distribution of mass toward the periphery until the emergence of low-density porous regions. (E to G) Overall, there was a total decrease in the number of observed packing domains from 78 to 62 upon RAD21 depletion; however, the remaining domains had similar CVC (E), scaling of packing (F), and size (G) in both conditions. P values represent two-tailed unpaired t test from the 78 and 62 packing domains. Bonferroni corrections were assumed for multiple comparisons (total of three) for an adjusted P value of 0.0166. (H) Analysis of packing domains by size and packing efficiency to analyze domain properties. Nascent domains (low efficiency and small size), mature domains (high packing efficiency), and decaying domains (low efficiency and large size) are differentially affected upon 1 μM ph-IAA for 6 hours. Black dashes represent mean packing efficiency and mean radius in control cells. (I) The primary decrease in packing domains occurred in nascent domains (low-density, small domains; n = 25 to 13, ~48% decrease) with a negligible change in the number of mature domains (high efficiency, n = 38 to 39, ~2% increase). Decaying domains were also decreased (low efficiency and large size; n = 15 to 10, 33% decrease). n.s., not significant.
Fig. 5.
Fig. 5.. RAD21 primarily localizes in regions of low DNA density.
(A to C) SMLM microscopy of RAD21 localization with DNA as stained by EDU. (A) Representative nuclear image of DNA stained with EdU with a localization average uncertainty of ~30 nm. (B) Representative image of RAD21 with SMLM with an average uncertainty of ~30 nm. (C) Overlay from two channels showing that RAD21 primarily localizes in regions devoid of large DNA domains. (D) Representative spatial analysis from two-color SMLM in (A) to (C) with a bounding region of 60 nm to measure the frequency of RAD21 (blue) association with DNA (purple) domains. Scale bar, 500 nm (E) Quantification of the frequency of RAD21 localizations associating with DNA domains in imaged nuclei (average, ~6.46%; n = 12). (F) Subgroup analysis of the type of domain RAD21 is within a 60-nm boundary of a domain showing that it primarily associates with larger domains (>80 nm) compared to small domains (20 to 80 nm). Analysis is from n = 12 cells, P value < 0.05. Rarely, RAD21 events were found at the intersection of large and small domains (both, <1%).
Fig. 6.
Fig. 6.. Analysis of TAD and loop domains indicates no significant change in global or local ATAC-seq loci with cohesin depletion.
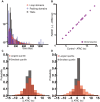
(A) Comparison of packing domain DNA content (median, 89.32 kbp; minimum of 6.27 kbp and maximum of 1.306 Mbp) in comparison to loop domains (median, 170 kbp; minimum of 9 kbp and maximum of 9.06 Mbp) and TADs (median, 130 kbp; minimum of 60 kbp and maximum of 2.55 Mbp) showing similar ranges in size in control cells. (B) Analysis of ATAC-seq accessibility per chromosome in control cells versus RAD21(−) cells showing no significant change in global accessibility. Axes are reported in number of loci times 103. (C) Analysis of the change in number of ATAC-seq loci within TAD coordinates before and after RAD21 depletion showing no change in accessibility in TAD regions upon their loss (median = 0, interquartile range of −2 to +2). (D) Analysis of the change in number of ATAC-seq loci within loop domain coordinates before and after RAD21 depletion showing no change in accessibility in loop regions upon their loss (median = 0, interquartile range of −2 to +2).
Fig. 7.
Fig. 7.. Analysis of nucleosome modifications with RAD21 depletion.
(A) RAD21 depletion is associated with a chromosome-wide accumulation of H3K9me3 (23% increase) and a decrease in H3K27ac (13% decrease) in a population ensemble. (B and C) Comparison of loop domains and TADs to RAD21 depletion demonstrating a parallel transformation. (B) H3K9me3 marks increase, predominantly within longer loops and TADs. (C) H3K27ac marks decrease independent of loop or TAD length. (D) Chia-PET Pol-II–mediated loops as a function of interaction frequency demonstrating stability to RAD21 depletion. X and Y axis scales represent log10 number of loop events. (E) Chia-PET of CTCF-mediated loops as a function of interaction frequency demonstrating loss upon RAD21 depletion at the level of nucleosome posttranslational modifications. X and Y axis scales represent log10 number of loop events. (F) Analysis of H3K9me3 and H3K27ac loci within Pol-II loops demonstrating that, phenotypically, they behave similar to RAD21-mediated loops.
Fig. 8.
Fig. 8.. HDAC3 inhibition is associated with impaired packing domain maturation and accumulation of nascent domains.
(A) Representative tomogram from control HCT-116 cells compared to (B) HCT-116 cells treated with 1 μm of Rgfp966 for 24 hours to inhibit HDAC3 function. Visually, packing domain structures have decreased in size. (C) Representative visualized loop of DNA in Rgfp966-treated cells. (D) Representative packing domain from Rgfp966-treated cells demonstrating expansion and decreased core density. (E) Quadrant analysis of the respective domain types in control versus HDAC3-inhibited cells. (F) Analysis of chromatin packing domains demonstrating an accumulation of nascent domains (74% increase) and small mature domains (100% increase). Frequency of domains was adjusted to per cubic micron due to differences in the visualized sample area in control compared to HDAC3 inhibition. Concurrently, there is a decrease in the number of large, mature domains (37% decrease). This overall suggests that heterochromatic nucleosome posttranslational modifications help facilitate domain maturation and consolidation.
Fig. 9.
Fig. 9.. Packing domains are not the physical manifestations of TADs.
(A) Packing domains are distinct higher-order physical structures and are not the manifestation of TADs. (B) Cohesin in individual cells creates genomic allocations that form into nascent domains. (C) The maturation of nascent domains into mature structures and their maintenance depends, at least in part, on heterochromatin enzymes such as HDAC3.

References

    1. Virk R. K. A., Wu W., Almassalha L. M., Bauer G. M., Li Y., VanDerway D., Frederick J., Zhang D., Eshein A., Roy H. K., Szleifer I., Backman V., Disordered chromatin packing regulates phenotypic plasticity. Sci. Adv. 6, eaax6232 (2020). - PMC - PubMed
    1. Fudenberg G., Getz G., Meyerson M., Mirny L. A., High order chromatin architecture shapes the landscape of chromosomal alterations in cancer. Nat. Biotechnol. 29, 1109–1113 (2011). - PMC - PubMed
    1. Soochit W., Sleutels F., Stik G., Bartkuhn M., Basu S., Hernandez S. C., Merzouk S., Vidal E., Boers R., Boers J., van der Reijden M., Geverts B., van Cappellen W. A., van den Hout M., Ozgur Z., van IJcken W. F. J., Gribnau J., Renkawitz R., Graf T., Houtsmuller A., Grosveld F., Stadhouders R., Galjart N., CTCF chromatin residence time controls three-dimensional genome organization, gene expression and DNA methylation in pluripotent cells. Nat. Cell Biol. 23, 881–893 (2021). - PubMed
    1. Arnould C., Rocher V., Saur F., Bader A. S., Muzzopappa F., Collins S., Lesage E., Le Bozec B., Puget N., Clouaire T., Mangeat T., Mourad R., Ahituv N., Noordermeer D., Erdel F., Bushell M., Marnef A., Legube G., Chromatin compartmentalization regulates the response to DNA damage. Nature 623, 183–192 (2023). - PMC - PubMed
    1. Bayona-Feliu A., Herrera-Moyano E., Badra-Fajardo N., Galván-Femenía I., Soler-Oliva M. E., Aguilera A., The chromatin network helps prevent cancer-associated mutagenesis at transcription-replication conflicts. Nat. Commun. 14, 6890 (2023). - PMC - PubMed

LinkOut - more resources