. 2025 Jan 24;20(1):e0317008.
doi: 10.1371/journal.pone.0317008. eCollection 2025.

Genome-wide identification and characterization of cation-proton antiporter (CPA) gene family in rice (Oryza sativa L.) and their expression profiles in response to phytohormones

Affiliations

Genome-wide identification and characterization of cation-proton antiporter (CPA) gene family in rice (Oryza sativa L.) and their expression profiles in response to phytohormones

Md Shohel Ul Islam et al. PLoS One. .

Abstract

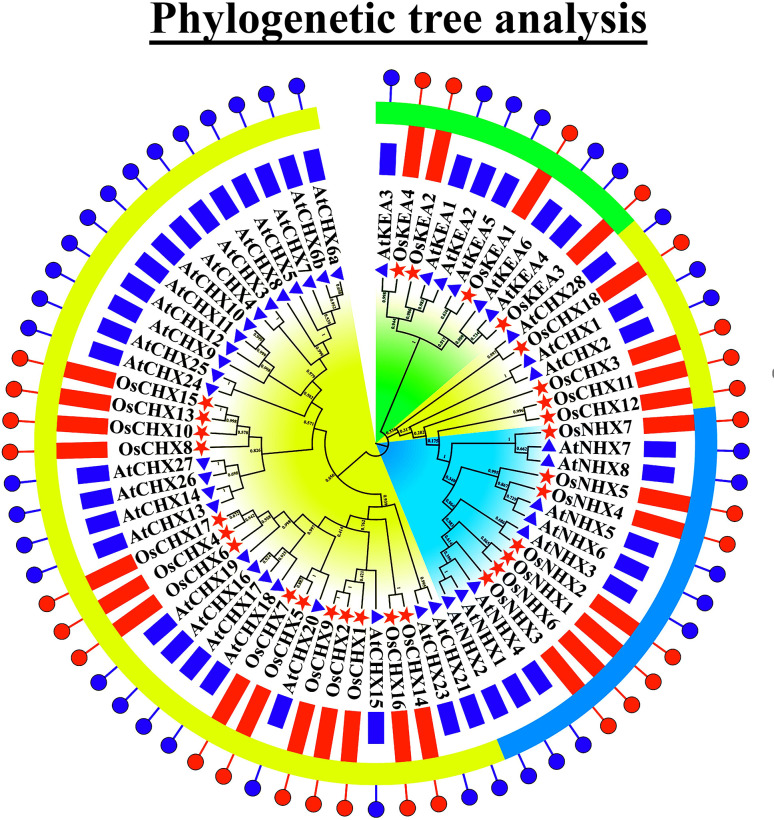
The cation-proton antiporter (CPA) superfamily plays pivotal roles in regulating cellular ion and pH homeostasis in plants. To date, the regulatory functions of CPA family members in rice (Oryza sativa L.) have not been elucidated. In this study, we use rice public data and information techniques, 29 OsCPA candidate genes were identified in the rice japonica variety (referred to as OsCPA) and phylogenetically categorized into K+ efflux antiporter (KEA), Na+/H+ exchanger (NHX), and cation/H+ exchanger (CHX) groups containing 4, 7, and 18 OsCPA genes. The OsCPA proteins were predominantly localized in the plasma membrane and unevenly scattered on 11 chromosomes. The structural analysis of OsCPA proteins revealed higher similarities within groups. Prediction of selection pressure, collinearity, and synteny analysis indicated that all duplicated OsCPA genes had undergone strong purifying selection throughout their evolution. The cis-acting regulatory elements (CAREs) analysis identified 56 CARE motifs responsive to light, tissue, hormones, and stresses. Additionally, 124 miRNA families were identified in the gene promoters, and OsNHX7 was targeted by the highest number of miRNAs (43 miRNAs). Gene Ontology analysis demonstrated the numerous functions of OsCPA genes associated with biological processes (57.14%), cellular components (7.94%), and molecular functions (34.92%). A total of 12 transcription factor families (TFFs), including 40 TFs were identified in gene promoters, with the highest numbers of TFFs (5TFFs) linked to OsCHX13, and OsCHX15. Protein-protein interaction analysis suggested maximum functional similarities between rice and Arabidopsis CPA proteins. Based on expression analysis, OsKEA1, OsKEA2, OsNHX3, and OsNHX7 were frequently expressed in rice tissues. Furthermore, OsNHX3, OsNHX4, OsNHX6, OsNHX7, OsCHX8, and OsCHX17 in abscisic acid, OsKEA1, OsNHX3, and OsCHX8 in gibberellic acid, OsKEA1, OsKEA3, OsNHX1, and OsNHX3 in indole-3-acetic acid treatment were demonstrated as potential candidates in response to hormone. These findings highlight potential candidates for further characterization of OsCPA genes, which may aid in the development of rice varieties.


Conflict of interest statement

The authors have declared that no competing interests exist.

Figures

Fig 1
Fig 1. The phylogenetic relationship among 29 OsCPA and 42 AtCPA proteins.
The CPA family was classified into 3 groups (KEA, NHX, and CHX). The KEA group is indicated by green color, the NHX group is indicated by turquoise color, and the CHX group is indicated by yellow color. The OsCPA and AtCPA genes are represented by a red star and blue triangle.
Fig 2
Fig 2. Distributions of conserved domains of OsCPA proteins.
The relative positions of each domain are demonstrated in differently colored boxes, with corresponding domain names.
Fig 3
Fig 3. The gene structure of OsCPAs.
For all OsCPA genes, black lines represent introns, pink-bold lines represent exons, and bright-green lines represent 5’ and 3’ UTRs. The exon/intron structure of each OsCPA gene is displayed proportionally according to the scale at the bottom.
Fig 4
Fig 4. The distribution of conserved motifs in OsCPA proteins.
The conserved motifs were identified in OsCPA proteins with a maximum number of 20. Each colored box aligned on the right side of the figure represents a specific motif.
Fig 5
Fig 5. The estimation of gene duplication for different paralogous gene pairs among OsCPA genes based on Ka and Ks values.
The number of non-synonymous substitutions per non-synonymous site is represented by Ka, while the number of synonymous substitutions per synonymous site is represented by Ks values. The ratio of Ka to Ks changes is represented by Ka/Ks. The color gradient on the right side represents the values ranging from blue to red (0 to 2.10).
Fig 6
Fig 6. Collinearity and synteny analysis.
A. The collinearity analysis of the OsCPA genes. OsCPA collinear blocks within the rice genome were represented by bright-green colored lines. The bright-green colored rectangles represent chromosomes 1–12. B. The synteny analysis of CPA genes between rice, Arabidopsis, maize, soybean, sorghum, and potato. The syntenic gene pairs of OsCPA are indicated by red colored lines. The chromosomes of different species are also represented by different colors.
Fig 7
Fig 7. The chromosomal localizations of OsCPA genes.
The chromosome numbers are aligned on the top of each chromosome bar. The chromosome-scale on the left-side represents the chromosome length.
Fig 8
Fig 8. Sub-cellular localization analysis of OsCPA proteins.
A. A heatmap represents the protein signals of OsCPA across various cellular organelles. The names of CPA proteins are shown on the left side of the heatmap, and the names of the corresponding cellular organelles are labeled at the bottom. The color intensity shown on the right side of the heatmap represents the presence of protein signals corresponding to the genes. B. The percentage of OsCPA protein signals across various cellular organelles is represented by a bar-plot. The percentages of protein signals appearing in different cellular organelles are shown on the left side of the bar-plot.
Fig 9
Fig 9. The distribution of putative CAREs on the 2.0 kb promoter region of OsCPA genes is represented by a heatmap.
The names of each OsCPA gene are shown on the left side of the heatmap. The number of putative CAREs for each OsCPA gene is represented by four different color gradients (black = 0, green = 1–3, red = 4–6, pink = 7–9, and blue = 10–12). CAREs of the corresponding genes, associated with light responsiveness, tissue-specific expression, phytohormone responsiveness, and stress responsiveness are shown at the bottom of the heatmap and denoted by bold lines in red, yellow, blue, and pink, respectively.
Fig 10
Fig 10. Predicted miRNAs target site analysis.
A. The network illustrates the predicted miRNA targeting OsCPA genes. Light blue rectangles represent the putative miRNAs and red circles represent the targeted OsCPA genes. B. The schematic diagram represents the OsCPA genes targeted by miRNAs and the red color represents the putative miRNA target sites of each gene.
Fig 11
Fig 11. GO analysis of OsCPA genes.
GO enrichment analysis of differentially expressed genes (DEGs) is represented by a diagram. GO terms of biological functions (biological process, cellular component, and molecular functions) of these DEGs are shown on the right side of the circle and the number of the corresponding OsCPA gene is shown inside of the circle by different colors.
Fig 12
Fig 12. TFs analysis of OsCPA genes.
A. A heatmap represents the predicted TFs in OsCPA gene promoters. The name of each OsCPA gene is aligned on the bottom of the heatmap. The major eight TFFs are shown on the left side of the heatmap. The color intensity was also shown on top of the heatmap. B. The regulatory network between TFs and OsCPA genes. The interactions between OsCPA genes and their regulatory TFs are represented through the regulatory network. The yellow circles indicate OsCPA genes and the light blue color shapes represent TF families.
Fig 13
Fig 13. The PPI network of OsCPA proteins.
The proteins are represented as network nodes and the colored lines indicate different data sources. Thicker lines represent a higher coefficient.
Fig 14
Fig 14. Expression profiles of OsCPA genes in 12 tissues.
The name of each OsCPA gene is shown on the right side and the tissue types are represented at the bottom of the heatmap. The expression values were mapped using a color gradient from green to red (count = 0–8) shown on the right side of the heatmap. The abbreviation “DAP” on the tissue label represents “Days after pollination”.
Fig 15
Fig 15. Expression profiles of OsCPA genes under hormonal treatments.
The name of each OsCPA gene is shown on the right side of the heatmap and the name of the rice varieties and hormones are represented at the bottom of the heatmap. The red, blue, and green colors represent HH3, HY73, and HH7A varieties, respectively. The expression values were mapped using a color gradient from green to red (count = 0–6) shown on the right side of the heatmap.

Similar articles

References

    1. Masrati G, Dwivedi M, Rimon A, Gluck-Margolin Y, Kessel A, Ashkenazy H, et al.. Broad phylogenetic analysis of cation/proton antiporters reveals transport determinants. Nat Commun. 2018;9(1):4205. doi: 10.1038/s41467-018-06770-5 . - DOI - PMC - PubMed
    1. Wang Y, Ying J, Zhang Y, Xu L, Zhang W, Ni M, et al.. Genome-Wide Identification and Functional Characterization of the Cation Proton Antiporter (CPA) Family Related to Salt Stress Response in Radish (Raphanus sativus L.). Int J Mol Sci. 2020;21(21):8262. doi: 10.3390/ijms21218262 . - DOI - PMC - PubMed
    1. Bassil E, Coku A, Blumwald E. Cellular ion homeostasis: emerging roles of intracellular NHX Na+/H+ antiporters in plant growth and development. J Exp Bot. 2012;63(16):5727–40. doi: 10.1093/jxb/ers250 . - DOI - PubMed
    1. Mäser P, Thomine S, Schroeder JI, Ward JM, Hirschi K, Sze H, et al.. Phylogenetic relationships within cation transporter families of Arabidopsis. J Plant Physiol. 2001;126(4):1646–67. doi: 10.1104/pp.126.4.1646 - DOI - PMC - PubMed
    1. Zhou H, Qi K, Liu X, Yin H, Wang P, Chen J, et al.. Genome-wide identification and comparative analysis of the cation proton antiporters family in pear and four other Rosaceae species. Mol Genet Genomics. 2016;291(4):1727–42. doi: 10.1007/s00438-016-1215-y . - DOI - PubMed

LinkOut - more resources