. 2025 Jan 24;20(1):e0313992.
doi: 10.1371/journal.pone.0313992. eCollection 2025.

Sulfur dioxide exposure of mice induces peribronchiolar fibrosis-A defining feature of deployment-related constrictive bronchiolitis

Affiliations

Sulfur dioxide exposure of mice induces peribronchiolar fibrosis-A defining feature of deployment-related constrictive bronchiolitis

Seagal Teitz-Tennenbaum et al. PLoS One. .

Abstract

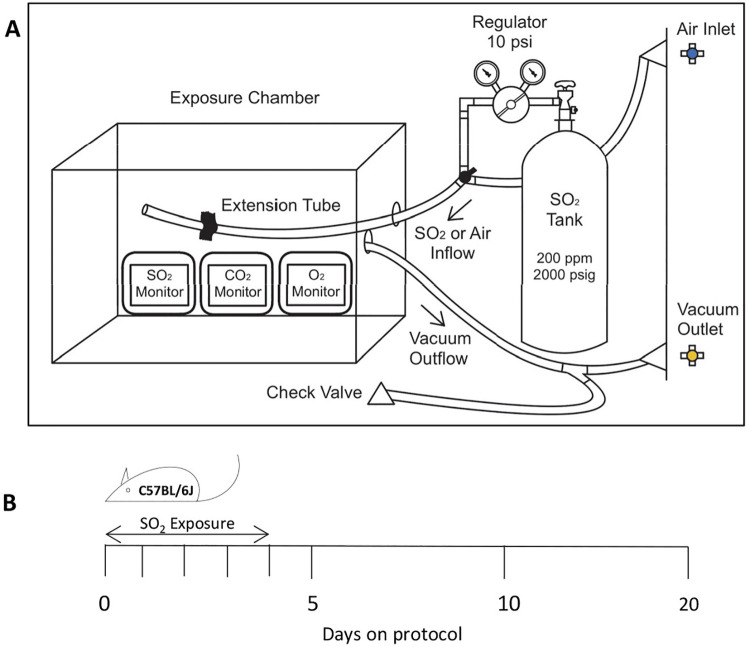
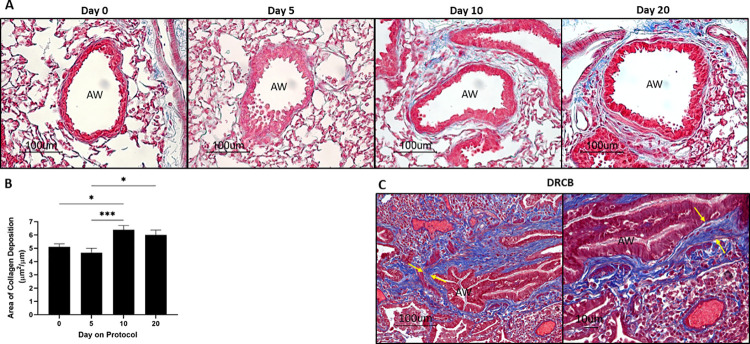
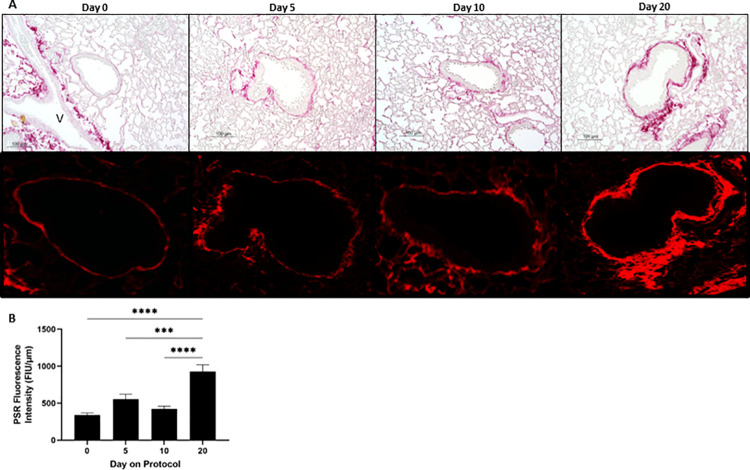
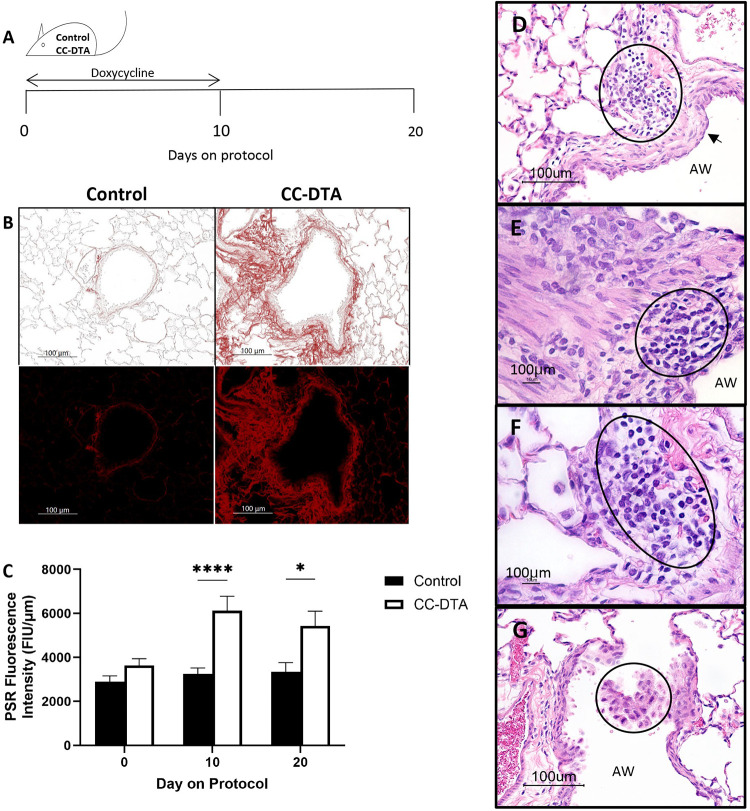
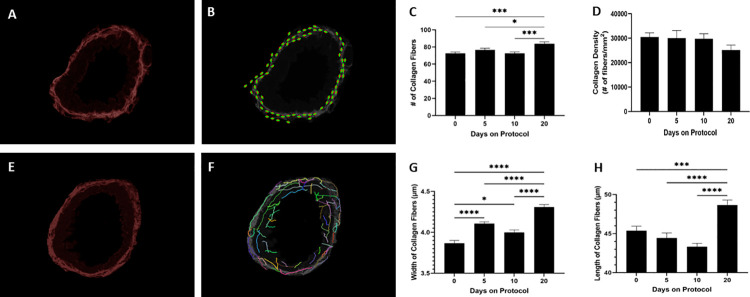
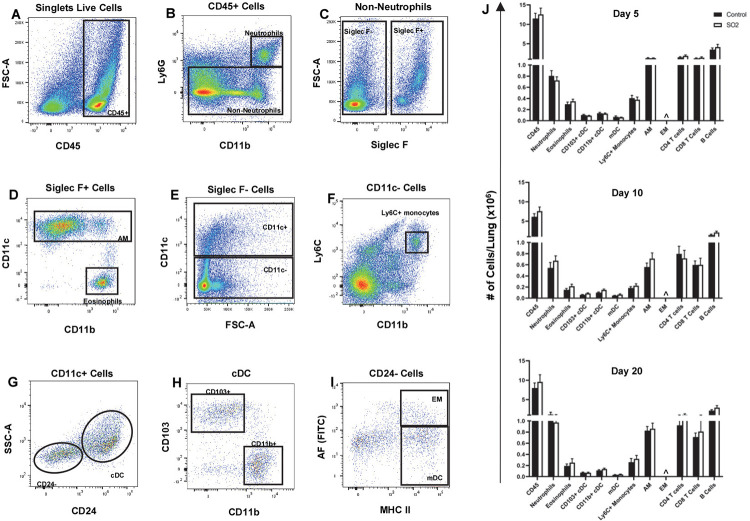
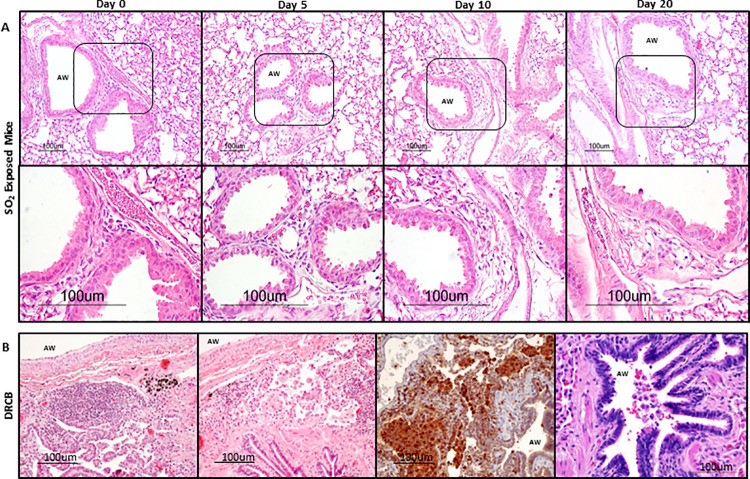
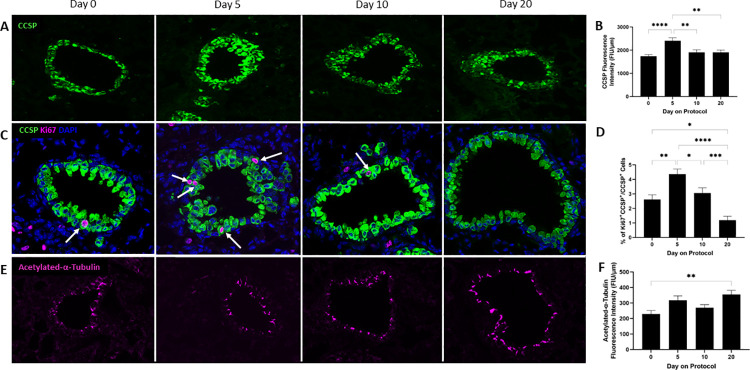
Deployment-related constrictive bronchiolitis (DRCB) has emerged as a health concern in military personnel returning from Southwest Asia. Exposure to smoke from a fire at the Al-Mishraq sulfur enrichment facility and/or burn pits was reported by a subset of Veterans diagnosed with this disorder. DRCB is characterized by thickening and fibrosis of small airways (SA) in the lung, but whether these are related to toxin inhalation remains uncertain. The aim of this study was to determine whether sulfur dioxide (SO2) exposure can induce histopathological features of DRCB. C57BL/6J mice were exposed to 50 ± 5 ppm SO2 for one hour/day for five consecutive days. Lungs from exposed and unexposed mice were evaluated on day 5, 10, and 20. Lung sections were stained using hematoxylin and eosin, Masson's trichrome, picrosirius red (PSR), and immunofluorescence for club cell secretory protein, acetylated-α-tubulin, and Ki67. Small airway wall thickness was determined by morphometric analysis and collagen content was quantified by measuring PSR fluorescence intensity. CurveAlign and CT-FIRE were used to enumerate collagen fibers and assess fibers' width and length, respectively. Leukocyte subpopulations were quantified by flow cytometry analysis. This protocol of SO2 exposure of mice: 1) Triggered club cell proliferation and differentiation; 2) Increased SA wall thickness by inducing subepithelial collagen deposition; and 3) Increased width, length, and number, but not density, of collagen fibers within the wall of SA. 4) Induced no peribronchiolar inflammation or respiratory bronchiolitis. Collectively, these findings implicate club cell proliferation and differentiation in the profibrotic response to SO2 and identify this SO2 exposure as a potentially effective though imperfect model for studying SA fibrosis in DRCB.


Conflict of interest statement

The authors have declared that no competing interests exist.

Figures

Fig 1
Fig 1. Sulfur dioxide (SO2) exposure chamber and exposure protocol.
(A) Diagram of SO2 exposure chamber installed and operated inside a fume hood. (B) Schematic representation of SO2 exposure protocol. Cohorts of C57BL/6J mice were exposed to 50 ± 5 ppm SO2 in air for one hour a day for five consecutive days on protocol day 0–4. Control mice were not exposed to SO2. Lungs were harvested on protocol day 5, 10, and 20 for examination.
Fig 2
Fig 2. SO2 exposure increases small airway (AW) wall thickness.
(A) Representative images of SA from Masson’s trichrome-stained lung sections of mice at the designated protocol time points. Day 0 denotes control, unexposed mice. Note blue stain, depicting collagen, surrounding SA at day 10 and 20. Scale bars: 100 μm. (B) Morphometric analysis of small airway wall thickness in lung sections from mice at the indicated protocol time points. The area, determined by demarcating the basement membrane and the outer edge of the airway adventitia, was normalized to the length of the subepithelial basement membrane. Data represent mean ± SEM of 90–100 SA; ten randomly selected SA per lung lobe, 4–5 lobes per mouse, two mice per time point. * P < 0.05, *** P < 0.001; one-way ANOVA followed by Tukey’s multiple comparisons test. (C) Representative images of a small airway from Masson’s trichrome-stained sections of a surgical lung biopsy of a Veteran diagnosed with DRCB. Note thickening of the airway wall due to subepithelial collagen deposition marked by yellow arrows. Scale bars: 100 μm (Left), 10 μm (Right).
Fig 3
Fig 3. SO2 exposure increases collagen content in the wall of small airways.
(A) Representative images of SA from picrosirius red (PSR)-stained lung sections of mice at the designated protocol time points. Day 0 denotes control, unexposed mice. Upper panels, phase-contrast microscopy; Lower panels, fluorescence microscopy; blood vessel, V. Note that the fine red stain, depicting collagen, surrounding small airways at day 0, 5, and 10 turns thick and coarse at day 20. Scale bars: 100 μm. (B) Subepithelial collagen content in the walls of SA of mice at the indicated protocol time points was quantified by measuring PSR fluorescence intensity in the wall of SA in PSR-stained lung sections (lower panels of A) and reported as fluorescence intensity units (FIU) normalized to the length of the subepithelial basement membrane (measured in upper panels of A) as detailed in the Materials and methods section. Data represent mean ± SEM of 90–100 SA; ten randomly selected SA per lung lobe, 4–5 lobes per mouse, two mice per time point. *** P < 0.001, **** P < 0.0001; one-way ANOVA followed by Tukey’s multiple comparisons test.
Fig 4
Fig 4. Sustained club cell injury increases collagen content in the wall of small airways and induces peribronchiolar inflammation.
(A) Schematic representation of doxycycline exposure protocol. Cohorts of littermate control and CC-DTA mice were exposed to doxycycline in chow for ten consecutive days on protocol day 0–10. Lungs were harvested on protocol day 10, and 20 for examination. (B) Representative phase-contrast (upper panels) and fluorescent (lower panels) microscopy images of SA from PSR-stained lung sections of a control (Left) and CC-DTA (Right) mice exposed to doxycycline for 10 days and evaluated at protocol day 20. Note prominent red staining surrounding small airway of CC-DTA, but not control, mouse. Scale bars: 100 μm. (C) Subepithelial collagen content in the walls of SA from doxycycline-exposed control and CC-DTA mice at the indicated protocol time points (day 0 denotes unexposed mice) was quantified by measuring PSR fluorescence intensity in PSR-stained lung sections and reported as fluorescence intensity units (FIU) normalized to the length of the subepithelial basement membrane. Data represent mean ± SEM of 60–79 SA; all SA per lung lobe, five lobes per mouse, two mice per time point. * P < 0.05, **** P < 0.0001; unpaired t-test corrected for multiple comparisons using the Holm-Sidak method. (D-G) Representative images of small airways (AW) from H&E-stained lung sections of CC-DTA mice exposed to doxycycline for 10 days and evaluated at protocol day 20. Note features of DRCB such as squamous epithelial metaplasia (D, marked by an arrow), peribronchiolar mononuclear cell infiltrates (D, E, and F, marked by an oval), and clusters of intraluminal cells resembling enlarge, foamy macrophages (G, marked by a circle). Scale bars: 100 μm.
Fig 5
Fig 5. SO2 exposure increases the width, length, and number, but not density, of collagen fibers in the wall of small airways.
(A) A representative fluorescence microscopy image of a small airway from PSR-stained lung sections of mice at protocol day 20 analyzed for number of collagen fibers using CurveAlign. (B) CurveAlign-generated schematic representation of the number of collagen fibers identified in panel A. (C) The number of collagen fibers in the wall of SA in PSR-stained lung sections of mice at the indicated protocol time points was quantified using CurveAlign. (D) The density of collagen fibers in the wall of SA in PSR-stained lung sections of mice at the indicated protocol time points was calculated by dividing the number of fibers by the area of collagen deposition. (E) A representative fluorescence microscopy image of a small airway from PSR-stained lung sections of mice at protocol day 20 analyzed for mean width and length of collagen fibers using CT-FIRE. (F) CT-FIRE-generated schematic representation of the width and length of collagen fibers identified in panel E. (G and H) The mean width (G) and length (H) of collagen fibers in the wall of SA in PSR-stained lung sections of mice at the indicated protocol time points was quantified using CT-FIRE. (C, D, G, and H) Data represent mean ± SEM of 90–100 SA; ten randomly selected SA per lung lobe, 4–5 lobes per mouse, and two mice per time point. * P < 0.05, *** P < 0.001, **** P < 0.0001; one-way ANOVA followed by Tukey’s multiple comparisons test. In panel D, no statistically significant differences between the groups were observed.
Fig 6
Fig 6. SO2 exposure induces no accumulation of leukocytes in the lung.
(A-I) Gating strategy for identifying lung myeloid subsets in control and SO2-exposed mice. Lung-derived single cell suspensions obtained from control and SO2-exposed mice were stained using fluorochrome-conjugated antibodies targeting CD45, Ly6G, CD11b, Siglec F, CD11c, Ly6C, CD24, CD103, and MHC class II and analyzed by flow cytometry. Representative dot plots from a single mouse exposed to SO2 and evaluated on protocol day 10 are shown. After excluding doublets, debris, and dead cells, CD45+ white blood cells were identified (A). Neutrophils were detected based on expression of Ly6G and CD11b (B). Non-neutrophils, Siglec F+ cells (C) were depicted on CD11b versus CD11c plots to identify eosinophils and alveolar macrophages (AM, D). Ly6C+ monocytes were defined as non-neutrophils, Siglec F-CD11c-CD11b+Ly6C+ cells (E and F). Conventional DC (cDC) were identified as non-neutrophils, Siglec F-CD11c+CD24+ cells (G) and further classified based on expression of CD103 or CD11b (H). CD24- cells within the CD11c+ gate were depicted on MHC class II versus autofluorescence (detected in the FITC channel) plots to identify exudate macrophages (EM) and monocyte-derived DC (mDC, I). FSC, forward scatter; SSC, side scatter; A, area, DC, dendritic cells, MHC, major histocompatibility complex. (J) Total numbers of leukocytes (CD45+ cells) and each indicated leukocyte subset per SO2 exposed and control mouse lung at protocol day 5 (upper), 10 (middle), and 20 (lower)were determined. Data represent mean ± SEM of five mice. ^ < 0.004 x 10⁶/lung for both control and SO2-exposed mice, bars are too low to be depicted. No statistically significant differences between SO2 exposed (white bars) versus control (black bars) mice were detected, unpaired t-test corrected for multiple comparisons using the Holm-Sidak method.
Fig 7
Fig 7. SO2 exposure induces no discernable peribronchiolar inflammation.
(A) Representative images of SA from hematoxylin and eosin (H&E)-stained lung sections of mice at the designated protocol time points. Day 0 denotes control, unexposed mice. Note the presence of sparse, loose clusters of immune cells (marked by inserts in the upper panels) next to SA and blood vessels in both control and SO2 exposed mice, regardless of protocol time point. Lower panels show higher magnification of inserts. (B) Representative images of SA from lung sections of a Veteran diagnosed with DRCB. Left, middle left, and right panels were stained with H&E; middle right panel was stained for CD68 using immunohistochemistry (brown stain depicts monocytes and macrophages). Note peribronchiolar pigment deposition (left panel), peribronchiolar mononuclear cell infiltrates (left and middle left panels), peribronchiolar collections of CD68+ cells (middle right panel), and clusters of intraluminal cells resembling big, foamy macrophages (right panel).
Fig 8
Fig 8. SO2 exposure triggers proliferation and differentiation of club cells.
(A, C, and E) Representative images of SA from lung sections of mice at the indicated protocol time points stained using immunofluorescent antibodies targeting club cell secretory protein (CCSP, A and C), Ki67 (C), DAPI (C), or/and acetylated-α-tubulin (E). Note the abundance of CCSP+ cells in the airway of SO2-exposed mice at protocol day 5 suggestive of club cell hyperplasia. (B and F) Fluorescent intensity of CCSP (B) and acetylated-α-tubulin (F) within the small airway epithelium was quantified and normalized to the length of the subepithelial basement membrane. (D) The percentage of proliferating club cells [(Ki67+DAPI+CCSP+/DAPI+CCSP+)*100] in each SA was determined. Data represent mean ± SEM of 89–100 SA; ten randomly selected or all SA per lung lobe, 4–5 lobes per mouse, two mice per time point. * P < 0.05, ** P < 0.01, **** P < 0.0001; one-way ANOVA followed by Tukey’s multiple comparisons test.

Similar articles

References

    1. National Academies of Sciences Engineering and Medicine. 2020. Respiratory health effects of airborne hazards exposures in the southwest Asia theater of military operations. Washington, DC: The National Academies Press. - PubMed
    1. Self-reported illness and health status among Gulf War veterans. A population-based study. The Iowa Persian Gulf Study Group. JAMA. 1997;277(3):238–45. Epub 1997/01/15. . - PubMed
    1. Medinger AE, Chan TW, Arabian A, Rohatgi PK. Interpretive algorithms for the symptom-limited exercise test: assessing dyspnea in Persian Gulf war veterans. Chest. 1998;113(3):612–8. Epub 1998/03/27. doi: 10.1378/chest.113.3.612 . - DOI - PubMed
    1. Coker WJ, Bhatt BM, Blatchley NF, Graham JT. Clinical findings for the first 1000 Gulf war veterans in the Ministry of Defence’s medical assessment programme. BMJ. 1999;318(7179):290–4. Epub 1999/01/29. doi: 10.1136/bmj.318.7179.290 ; PubMed Central PMCID: PMC27710. - DOI - PMC - PubMed
    1. Kelsall HL, Sim MR, Forbes AB, McKenzie DP, Glass DC, Ikin JF, et al.. Respiratory health status of Australian veterans of the 1991 Gulf War and the effects of exposure to oil fire smoke and dust storms. Thorax. 2004;59(10):897–903. Epub 2004/09/30. doi: 10.1136/thx.2003.017103 [pii]. ; PubMed Central PMCID: PMC1746848. - DOI - PMC - PubMed

LinkOut - more resources