. 2025 Jan 24;21(1):e1012883.
doi: 10.1371/journal.ppat.1012883. eCollection 2025 Jan.

Evolution of SARS-CoV-2 in white-tailed deer in Pennsylvania 2021-2024

Affiliations

Evolution of SARS-CoV-2 in white-tailed deer in Pennsylvania 2021-2024

Andrew D Marques et al. PLoS Pathog. .

Abstract

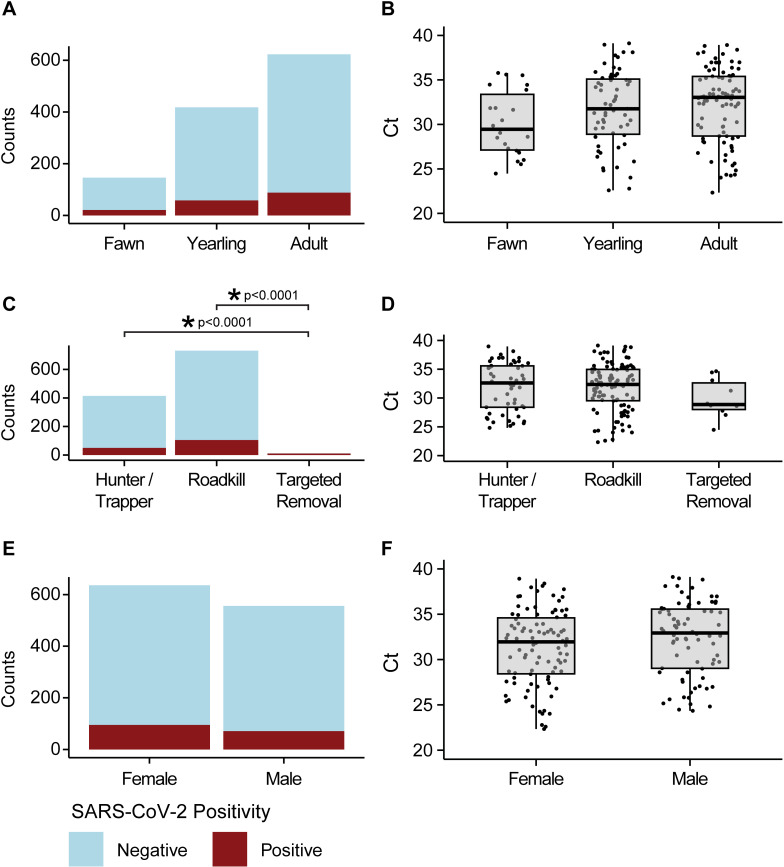
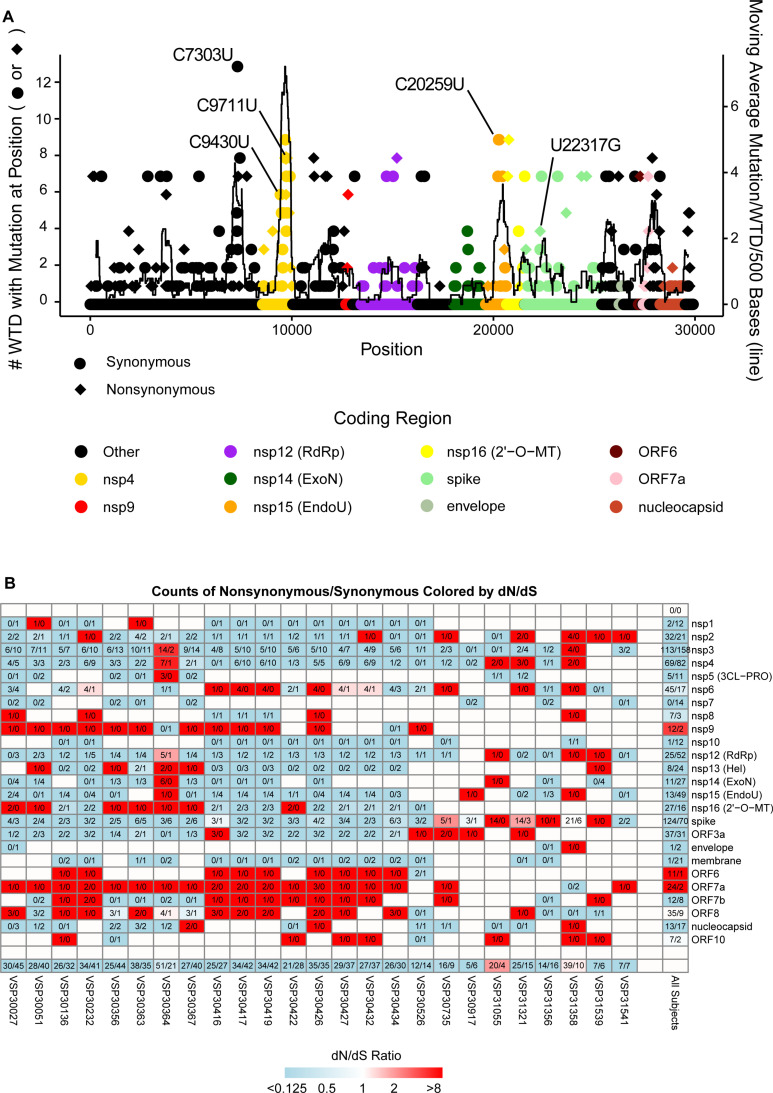
SARS-CoV-2 continues to transmit and evolve in humans and animals. White-tailed deer (Odocoileus virginianus) have been previously identified as a zoonotic reservoir for SARS-CoV-2 with high rates of infection and probable spillback into humans. Here we report sampling 1,127 white-tailed deer (WTD) in Pennsylvania, and a genomic analysis of viral dynamics spanning 1,017 days between April 2021 and January 2024. To assess viral load and genotypes, RNA was isolated from retropharyngeal lymph nodes and analyzed using RT-qPCR and viral whole genome sequencing. Samples showed a 14.64% positivity rate by RT-qPCR. Analysis showed no association of SARS-CoV-2 prevalence with age, sex, or diagnosis with Chronic Wasting Disease. From the 165 SARS-CoV-2 positive WTD, we recovered 25 whole genome sequences and an additional 17 spike-targeted amplicon sequences. The viral variants identified included 17 Alpha, 11 Delta, and 14 Omicron. Alpha largely stopped circulating in humans around September 2021, but persisted in WTD as recently as March of 2023. Phylodynamic analysis of pooled genomic data from Pennsylvania documents at least 12 SARS-CoV-2 spillovers from humans into WTD, including a recent series of Omicron spillovers. Prevalence was higher in WTD in regions with crop coverage rather than forest, suggesting an association with proximity to humans. Analysis of seasonality showed increased prevalence in winter and spring. Multiple examples of recurrent mutations were identified associated with transmissions, suggesting WTD-specific evolutionary pressures. These data document ongoing infections in white-tailed deer, probable onward transmission in deer, and a remarkable rate of new spillovers from humans.


Conflict of interest statement

The authors have declared that no competing interests exist.

Figures

Fig 1
Fig 1. RT-qPCR results for pooled Pennsylvania WTD samples from 2021–2024.
(A) Counts of WTD stratified by age. Categories include fawn, yearling, and adult, and are colored by RT-qPCR results. Here and below, blue indicates RT-qPCR negative and red indicates RT-qPCR positive animals. (B) Ct values of positive samples displayed with box plots for fawn, yearling, and adult WTD. (C) RT-qPCR counts stratified by cause of death (hunter harvested or trapped, roadkill, or targeted removal). (D) Ct values of the RT-qPCR positive WTD stratified by cause of death. (E) RT-qPCR counts stratified by female or male. (F) Ct values for RT-qPCR positive WTD.
Fig 2
Fig 2. RT-qPCR for pooled WTD from Pennsylvania 2021–2024 analyzed by season.
(A) RT-qPCR counts stratified by season (x-axis: spring, summer, fall, and winter). Blue indicates SARS-CoV-2 negative, red indicates SARS-CoV-2 positive by RT-qPCR. The y-axis represents the number of counts in each season. (B) Ct values of RT-qPCR positive samples stratified by season. (C) Prevalence in aggregate data from RPLN and nasal swabs binned by week. Blue indicates SARS-CoV-2 negative and red indicates SARS-CoV-2 positive by RT-qPCR. The y-axis represents the number of counts per week; x-axis indicates time. (D) Auto-regressive moving average logistic regression estimating SARS-CoV-2 positivity by RT-qPCR over time. Grey indicates the 95% credible interval. The y-axis represents the estimated percent positive of the sampled population; x-axis indicates time.
Fig 3
Fig 3. Land use and clustering analysis of SARS-CoV-2 in WTD in Pennsylvania.
(A and B) Maps of Pennsylvania colored by land use category. The x and y-axes show latitude and longitude. The color of the data point indicates whether the sample was positive (red) or negative (blue) for SARS-CoV-2 by RT-qPCR. The shape of the data point indicates the major land use category from the area that the WTD was collected. Circles indicate crops/pasture, squares indicate developed, and triangles indicates forested. (A) Locations of SARS-CoV-2 positive WTD. (B) Locations of SARS-CoV-2 negative WTD. (C) Stacked bar plot showing the proportion SARS-CoV-2 positive (red) and negative (blue) WTD from predominantly crops/pasture compared to forested areas. The y-axis shows the proportions, the x-axis the land use category.
Fig 4
Fig 4. Circulating SARS-CoV-2 lineages in Pennsylvania WTD.
(A) Previously published WTD-derived SARS-CoV-2 sequences from Pennsylvania, with annotated county-level geographic information45. The x-axis represents time from 2020 to 2024, the y-axis represents the counts of each lineage, and the color indicates the identified variant/lineage from the deer-derived isolate. (B) WTD-derived SARS-CoV-2 sequences contributed from this paper (collection spanning 2021–2024). Markings as in (A). (C) Human-derived isolates subsampled to 10,000 Pennsylvania sequences from January 2020 to February 2024. The x-axis indicates time from 2020 to 2024, the y-axis represents the percent of total sequences for a given month from the subsampled 10,000 sequences available. Colors indicate the annotated viral variants (key to right). (D) Map of Pennsylvania showing ratio of samples testing positive for SARS-CoV-2, colored by estimated posterior proportion positive by county, with boxed labels containing month of collection and colored by SARS-CoV-2 variant. Teal indicates Alpha, purple indicates Delta, and red indicates Omicron.
Fig 5
Fig 5. Phylodynamics of Pennsylvania WTD SARS-CoV-2 genomes.
(A) The seven newly sequenced WTD SARS-CoV-2 isolates on a phylogenetic tree also containing subsampled human-derived isolates spanning the course of the SARS-CoV-2 pandemic. Genomes are labeled by lineage, and colored by host species. Green indicates human-derived isolates, light red indicates WTD-derived isolates new to this paper, and dark red indicates WTD-derived isolates from previous work [44,45,53]. Labeled letters indicate the suspected seven independent spillover events documented in this work. (B) Mutation heatmap paired with the phylogenetic tree showing the location of SNPs throughout the SARS-CoV-2 genome, colored by host species. Mutations are marked in reference to the earliest uploaded sequence to public databases (NC_045512.2). The x-axis represents the position in the SARS-CoV-2 genome and the y-axis represents an individual sample, paired with the data points on the phylogenetic tree. (C) Root-to-tip plot showing genetic divergence as the number of mutations from first introduction to the United States, colored by SARS-CoV-2 lineage with open circles indicating WTD-derived isolates and closed circles indicating human-derived isolates. The y-axis represents the time that the sample was collected and the x-axis represents the number of mutations accumulated in reference to the first detection of SARS-CoV-2 in the USA.
Fig 6
Fig 6. Analysis of accumulation of mutations.
(A) Plot of WTD SARS-CoV-2 mutation occurrence in reference to nearest human neighbor. Mutations for each WTD were determined using their nearest genetic human isolate as a reference. Circles indicate synonymous substitutions and diamonds represent nonsynonymous substitutions. Colors indicate the corresponding coding region. The data points (circle or diamond) represent how many WTD had a mutation at this position in the genome. The lines represent the moving average number of mutations per WTD per 500 base pair window. The y-axis on the left corresponds to the data points (circle or diamond) and the y-axis on the right corresponds to the moving average black line. (B) Nonsynonymous and synonymous mutation analysis (dN/dS analysis). The figure shows a heatmap for SARS-CoV-2 coding regions and WTD-derived isolates with labeled ratios for counts of nonsynonymous substitutions to synonymous substitutions colored by dN/dS ratio. Counts indicated as 4/7 would represent 4 nonsynonymous substitutions with 7 synonymous substitutions. Colors indicate the dN/dS ratio that is derived from counts of nonsynonymous divided by total possible nonsynonymous divided by counts of synonymous divided total possible synonymous. The darkest shade of blue indicates a dN/dS ratio of 0.125 or lower and the darkest shade of red indicates a dN/dS ratio of 8 or higher. Blue indicates that there are more than expected synonymous substitutions compared to nonsynonymous substitutions. Red indicates there are more than expected nonsynonymous substitutions than synonymous substitutions. Along the bottom row is a summary for each coding region in the WTD sampled (all coding regions within an individual animal). Along the right side of the grid is the summary for a coding region across all WTD (all isolates for a coding region). “VSP” indicates “viral specimen number”.

References

    1. Organization WH. COVID-19 cases | WHO COVID-19 dashboard. datadot; 2024.
    1. Zhao J, Kang M, Wu H, Sun B, Baele G, He WT, et al.. Risk assessment of SARS-CoV-2 replicating and evolving in animals. Trends Microbiol. 2024;32(1):79–92. doi: 10.1016/j.tim.2023.07.002 - DOI - PubMed
    1. Gómez JC, Cano-Terriza D, Segalés J, Vergara-Alert J, Zorrilla I, Del Rey T, et al.. Exposure to severe acute respiratory syndrome coronavirus 2 (SARS-CoV-2) in the endangered Iberian Lynx (Lynx pardinus). Vet Microbiol. 2024;290:110001. doi: 10.1016/j.vetmic.2024.110001 - DOI - PubMed
    1. Pereira AHB, Pereira GO, Borges JC, de Barros Silva VL, Pereira BHM, Morgado TO, et al.. A novel host of an emerging disease: SARS-CoV-2 infection in a giant anteater (Myrmecophaga tridactyla) kept under clinical care in Brazil. Ecohealth. 2022;19(4):458–62. doi: 10.1007/s10393-022-01623-6 - DOI - PMC - PubMed
    1. Vercammen F, Cay B, Gryseels S, Balmelle N, Joffrin L, Van Hoorde K, et al.. SARS-CoV-2 infection in captive hippos (Hippopotamus amphibius), Belgium. Animals (Basel). 2023;13(2). - PMC - PubMed

Substances