. 2025 Mar:80:103503.
doi: 10.1016/j.redox.2025.103503. Epub 2025 Jan 19.

Metabolic dependency mapping identifies Peroxiredoxin 1 as a driver of resistance to ATM inhibition

Affiliations

Metabolic dependency mapping identifies Peroxiredoxin 1 as a driver of resistance to ATM inhibition

Haojian Li et al. Redox Biol. 2025 Mar.

Abstract

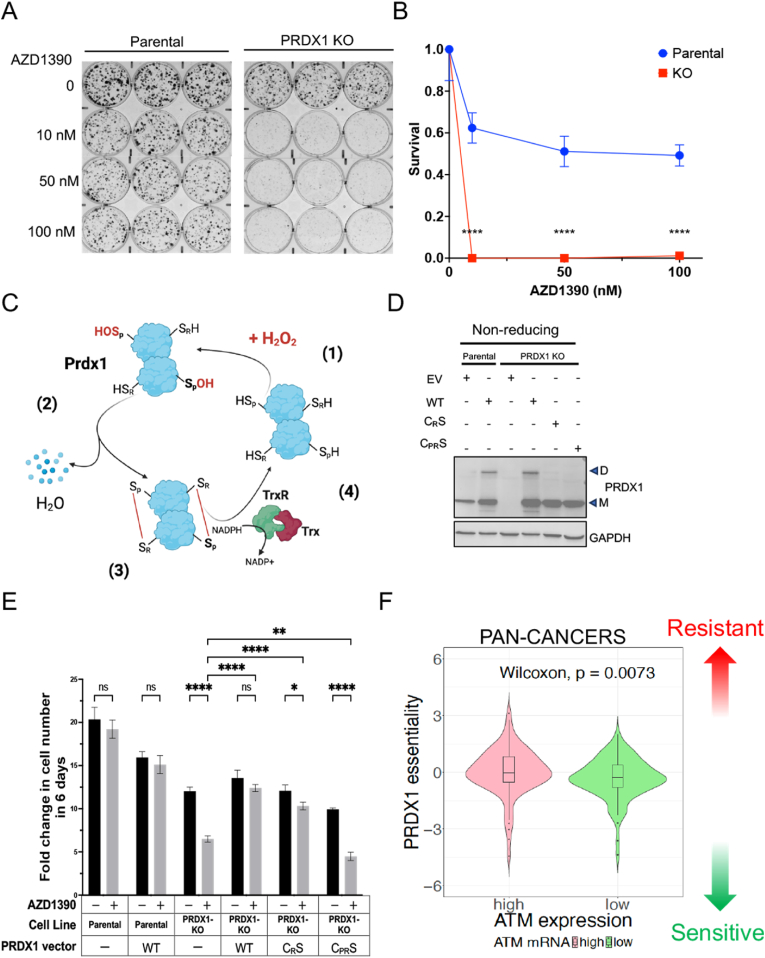
Metabolic pathways fuel tumor progression and resistance to stress conditions including chemotherapeutic drugs, such as DNA damage response (DDR) inhibitors. Yet, significant gaps persist in how metabolic pathways confer resistance to DDR inhibition in cancer cells. Here, we employed a metabolism-focused CRISPR knockout screen and identified genetic vulnerabilities to DDR inhibitors. We unveiled Peroxiredoxin 1 (PRDX1) as a synthetic lethality partner with Ataxia Telangiectasia Mutated (ATM) kinase. Tumor cells depleted of PRDX1 displayed heightened sensitivity to ATM inhibition in vitro and in mice in a manner dependent on p53 status. Mechanistically, we discovered that the ribosomal protein RPL32 undergoes redox modification on active cysteine residues 91 and 96 upon ATM inhibition, promoting p53 stability and altered cell fitness. Our findings reveal a new pathway whereby RPL32 senses stress and induces p53 activation impairing tumor cell survival.

Keywords: ATM kinase; Disulfide stress; Peroxiredoxin 1; RPL32 redox modification; p53 activation.


Conflict of interest statement

Declaration of competing interest The authors declare that they have no known competing financial interests or personal relationships that could have appeared to influence the work reported in this paper.

Figures

Fig. 1
Fig. 1
Metabolism-focused CRISPR knockout screen identified PRDX1 as a critical driver for ATM inhibitor resistance. (A) Cells were treated for 10 days with the ATM inhibitor AZD1390 at lower concentrations (10, 50, 100 nM), and stained for colonies count. B. Quantification. (C) Diagram illustrating the redox cycle mediated by PRDX1 upon oxidative stress induced by hydrogen peroxide (H2O2). Two PRDX1 proteins act cooperatively as a dimer upon oxidation. PRDX1 contains a conserved cysteine residue (Cys 52) in its N-terminal region, known as peroxidatic Cys (Cp-SH) which senses H2O2 and undergoes oxidation forming a sulfenic acid (Step 1). Similar to other typical 2-Cys peroxiredoxins, PRDX1 contains an additional conserved Cys residue in its C-terminus (Cys 173) known as resolving Cys (CR-SH). The disulfide structure formation in response to H2O2 consists of the peroxidatic Cys52 residue (CP–OH) from one PRDX1 and the resolving Cys172 residue (CRH) from the other homodimer subunit, and the release of H2O (Steps 2 and 3). This disulfide bond structure can be readily reduced by the Thioredoxin (Trx)-Thioredoxin reductase (TrxR) complex using NADPH (Step 4). (D) Western blot of parental and PRDX1-knockout A549 cells infected with either empty vector (EV), wild-type PRDX1 (WT), or the resolving Cys172 mutant (CRS), or the double mutant for peroxidatic Cys 52 and resolving Cys172 (CPRS). Note PRDX1 dimer (D) formation in cells expressing the wild-type form of PRDX1, and the presence of PRDX1 monomer (M) in mutants. (E) Survival of A549 parental cells expressing empty vector (parental-EV), parental cells with wild-type PRDX1 (Parental-WT), and PRDX1 knockout cells expressing either empty vector (KO-EV), or PRDX1 mutants (KO-CRS, KO-CPRS). Cells were treated with AZD1390 (1 μM) for 6 days. (F) Relationship between PRDX1 gene essentiality and ATM expression levels across pan-cancer cell lines. From the pan-cancer datasets, cancer cells were divided into two groups based on ATM expression levels: high ATM expression group (ATM mRNA high, represented by pink column on the left) and low ATM expression group (ATM mRNA low, represented by green column on the right). The y-axis represents the essentiality of PRDX1, which is the normalized growth reduction resulting from gene inactivation. Note that the essentiality of PRDX1 is significantly higher in high ATM-expressing cancer cells (pink) compared to low ATM-expressing cancer cells (green). Data are represented as mean ± SD; n = 4. ns, nonsignificant, ∗p < 0.05; ∗∗p < 0.01; ∗∗∗p < 0.001; ∗∗∗∗p < 0.0001.
Fig. 2
Fig. 2
PRDX1 loss promotes DNA breaks in NSCLC lines. (A) NCIH1299 Shcontrol and shPRDX1 cells were treated with DMSO or AZD1390 at a dose of 1 μM for 6 days. (B) Quantification of panel A. One-way ANOVA followed by Tukey's multiple comparisons test. (C) A549-Cas9 parental and PRDX1 KO cells were treated with DMSO or with AZD1390 at 1 μM for 6 days. (D) Quantification of panel C. One-way ANOVA followed by Tukey's multiple comparisons test. (E) A549-Cas9 parental and PRDX1 KO cells were infected with empty vector (EV), PRDX1 wild type (WT), PRDX1-CRS, or PRDX1-CPRS plasmids and used for comet assay. (F) Quantification of panel E. One-way ANOVA followed by Tukey's multiple comparisons test. ns, nonsignificant, ∗p < 0.05; ∗∗p < 0.01; ∗∗∗p < 0.001; ∗∗∗∗p < 0.0001.
Fig. 3
Fig. 3
p53 activation impaired growth in PRDX1-deficient cells in response to ATM inhibition. (A) Volcano plot representing gene expression profile of sgRNA-PRDX1 infected-A549-Cas9 cells (sgPRDX1) treated or not (DMSO) with AZD1390 (1 μM) or DMSO for 6 days. Blue dots represent the most downregulated genes, and red dots represent the most upregulated genes in PRDX1-deficient cells treated with AZD1390. (B) Ridgeplot of Gene Set Enrichment Analysis (GSEA) using Hallmark gene sets by comparing sgRNA-PRDX1 infected-A549-Cas9 cells (sgPRDX1) treated AZD1390 (1 μM) or DMSO. (C) Gene Set Enrichment Analysis (GSEA) of RNA-seq positively enriched genes related to p53 activation pathways corresponding to the samples A549-sgPRDX1 treated with AZD1390. (D) GSEA of RNA-seq negatively enriched genes related to E2F1 activation pathways corresponding to the samples A549-sgPRDX1 treated with AZD1390. (E) GSEA of RNA-seq positively enriched genes related to E2F1 activation pathways corresponding to the samples H1299-sgPRDX1 treated with AZD1390. (F) Western blot of control (shCTRL) and PRDX1-depleted NCI–H1299 cells (shPRDX1) treated with AZD1390 (1 μM) for 6 days. Note p21 expression level is unchanged between control and PRDX1-deficient cells treated with AZD1390. GAPDH was used as a loading control. (G) Western blot of parental (Parental) and PRDX1-knockout (PRDX1 KO) A549 cells infected with either empty vector (EV) or wild-type PRDX1 (WT), or with the resolving Cys172 mutant (CRS), or the double mutant for peroxidatic Cys 52 and resolving Cys172 (CPRS). Note PRDX1 dimer (D) formation in cells expressing the wild-type form of PRDX1, and the presence of PRDX1 monomer (M) in mutants using nonreducing conditions. Cells were treated with AZD1390 (1 μM) for 6 days. (H) Quantification of p21 protein levels as a direct indicator of p53 activation. (I) Western blot of parental A549 cells (parental) and PRDX1-knockout cells (PRDX1 KO) treated with AZD1390 (1 μM) for 6 days following p53 silencing by small interference RNA (siRNA). Note p53 expression level was detected as a direct readout of the siRNA efficacy over 6 days, and GAPDH was used as a loading control. P53 expression level was detected 48 h post siRNA transfection. (J) Survival of cells established in (I). ns, nonsignificant, ∗p < 0.05; ∗∗p < 0.01; ∗∗∗p < 0.001; ∗∗∗∗p < 0.0001.
Fig. 4
Fig. 4
p53 status dictates the response of Peroxiredoxin 1-deficient cells to ATM inhibitors in vivo. (A) Schematic of the experimental tumor model using A549 parental and PRDX1-knockout cells. (B) Quantification of tumor volume on Day 18 following treatment with AZD1390 (20 mg/kg). (C) Measurement of individual tumor volume throughout the experiment. (D) Kaplan-Meier survival curves for NSG mice injected with parental and PRDX1-KO cells and treated as indicated; n = 10. Statistical significance determined by log-rank test indicates. (E) Immunohistochemistry staining of p21-positive tumor cells (brown staining) comparing A549 parental and PRDX1-knockout cells treated with AZD1390 at the endpoint. (F) Quantification of p21-positive tumor cells. (G) Generation of KP5 tumor cells using CRISPR-mediated K-Ras mutation (G12D) and loss-of-function TP53 truncation, followed by intratracheal infection into C57BL/6J mouse and tumor burden. (H) Western blot of control (shCTRL) and PRDX1-depleted (shPRDX1) KP5 cells for the detection of PRDX1 expression level. (I) Schematic of the experimental tumor model using control (shCTRL) and PRDX1-depleted (shPRDX1) KP5 cells to establish a syngeneic model. (J) Measurement of individual tumor volume throughout the experiment. (K) Kaplan-Meier survival curves for C57BL/6J mice injected with control (shCTRL) or PRDX1-depleted (shPRDX1) KP5 cells and treated as indicated; n = 10. Statistical significance determined by log-rank test indicates. (L) Immunohistochemistry staining of p21-positive tumor cells (brown staining) comparing control (shCTRL) or PRDX1-depleted (shPRDX1) KP5 cells treated with AZD1390 at the endpoint. (M) Quantification of p21-positive tumor cells. ns, nonsignificant, ∗p < 0.05; ∗∗p < 0.01; ∗∗∗p < 0.001; ∗∗∗∗p < 0.0001. Note. Fig. 4A, G, and I are designed using Biorender.
Fig. 5
Fig. 5
Cells devoid of p53 activity are less sensitive to ATM inhibition upon PRDX1 loss. (A) Western blot analysis of NCIH1299 shControl and shPRDX1 cells. (B) Schematic of the experimental tumor model using NCIH1299 shControl (shCTRL) and shPRDX1 cells. (C) Measurement of individual tumor volume throughout the experiment. (D) Kaplan Meier survival curves for NSG mice injected with NCIH1299 shControl (shCTRL) and shPRDX1 cells and treated as indicated. n = 8–9. Statistical significance determined by log-rank test indicates. Note. Fig. 5B is designed with BioRender.
Fig. 6
Fig. 6
p53 status dictates the survival of patients across multiple human malignancies when expression of ATM and PRDX1 is impaired. (A, and B) Kaplan Meier (KM) survival curves of patients with pancreatic adenocarcinoma (PAAD). (A) Patients are stratified into two major groups, low expression of (ATM + PRDX1) genes with a wild type p53 status (WT p53) and low expression of (ATM + PRDX1) genes with a mutant p53 status (Mut p53). (B). A similar comparison was performed with patients with high expression of (ATM + PRDX1) genes. (C, and D) Kaplan Meier (KM) survival curves of patients with uterine corpus endometrial carcinoma (UCEC). A similar comparison between low and high (ATM + PRDX1) genes was performed as in (A, and B). (E, and F) Kaplan Meier (KM) survival curves of patients with lung adenocarcinoma (LUAD). A similar comparison between low and high (ATM + PRDX1) genes was performed as in (A, and B). (G, and H) Kaplan Meier (KM) survival curves of patients with kidney renal clear carcinoma (UCEC). A similar comparison between low and high (ATM + PRDX1) genes was performed as in (A, and B).
Fig. 7
Fig. 7
ATM inhibition promotes disulfide stress in PRDX1-deficient cells. (A) Survival of A549 parental and PRDX1 knockout (KO) cells treated with AZD1390 (1 μM) for 6 days in the presence of agents mitigating cell death pathways such as disulfide stress (TCEP), ferroptosis (Ferrostatin-1), or apoptosis (Z-VAD). Data are represented as mean ± SD; n = 4. (B) Measurement of reactive oxygen species (ROS) in A549 parental and PRDX1 knockout (KO) cells treated with AZD1390 (1 μM) for 6 days employing CellRox Green in flow cytometry. (C) Quantification of reactive oxygen species (ROS) levels in panel B. Data are represented as mean ± SD; n = 3.
Fig. 8
Fig. 8
RPL32 oxidation drives p53 stability. (A) Schematics of the Double alkylation approach employed to identify proteome-wide free thiols and disulfide-containing peptides. (B) Scatter plot of oxidized cysteine-containing peptides (dots) from the double alkylation assay as compared to total protein levels. Representative peptides labeled were upregulated at least 2-fold in PRDX1-knockout cells treated with AZD1390 in comparison to DMSO treatment. (C) Impact of RPL32 loss (left) and MDM2 loss (right) on cancer cells with/without p53 hotspot mutations. (D) Western blot of parental A549 cells transfected with siRNA targeting RPL32 for 48 h. (E) Schematics of MM(PEG)24 conjugation-based approach to determine protein cysteine thiol redox status by western blot. (F) Cysteine thiol redox status in parental and PRDX1-knockout cells treated with AZD1390 (1 μM) or DMSO for 6 days. Parental cell lysate was incubated with CuCl2 (30 μM) for the detection of oxidized RPL32, and with DTT (40 mM) for the detection of reduced RPL32. (G) Cysteine thiol redox status U2OS cells treated with the disulfide stress inducer diamide (200 μM) for 24 h. (H) Western blot of U2OS cells transfected with empty vector (EV), wild-type RPL32 (WT), C91S mutant form of RPL32 (C91S), C96S mutant form of RPL32 (C96S), or RPL32 double mutant (C91/96S) for 24 h. Cells were treated with hydrogen peroxide (H2O2 – 1mM) for 40 min. Vinculin was used as a loading control. (Free-C-SH)2, MM(PEG)24-conjugated RPL32 with two free cysteine residues; (Free-C-SH)1, MM(PEG)24-conjugated RPL32 with one free cysteine residue; (Free-C-SH)0, MM(PEG)24-unconjugated RPL32 with no free cysteine residue. Note. Fig. 8A is designed with BioRender.
Fig. 9
Fig. 9
Interplay between ATM and PRDX1 in tumor cells. This figure shows a simplified model depicting the role of PRDX1 loss, ATM inhibition, and RPL32 redox modification in p53 activation and cell survival. Note. This figure is designed with BioRender.

References

    1. Tubbs A., Nussenzweig A. Endogenous DNA damage as a source of genomic instability in cancer. Cell. 2017;168:644–656. - PMC - PubMed
    1. Blackford A.N., Jackson S.P. ATM, ATR, and DNA-PK: the trinity at the heart of the DNA damage response. Mol. Cell. 2017;66:801–817. - PubMed
    1. Shiloh Y., Ziv Y. The ATM protein kinase: regulating the cellular response to genotoxic stress, and more. Nat. Rev. Mol. Cell Biol. 2013;14:197–210. - PubMed
    1. Lee J.H., Paull T.T. Cellular functions of the protein kinase ATM and their relevance to human disease. Nat. Rev. Mol. Cell Biol. 2021;22:796–814. - PubMed
    1. Choi M., Kipps T., Kurzrock R. ATM mutations in cancer: therapeutic implications. Mol. Cancer Therapeut. 2016;15:1781–1791. - PubMed

MeSH terms

LinkOut - more resources