. 2025 Feb 18;6(2):101925.
doi: 10.1016/j.xcrm.2024.101925. Epub 2025 Jan 23.

Single-cell analysis of neoplastic plasma cells identifies myeloma pathobiology mediators and potential targets

Affiliations

Single-cell analysis of neoplastic plasma cells identifies myeloma pathobiology mediators and potential targets

Luz Yurany Moreno Rueda et al. Cell Rep Med. .

Abstract

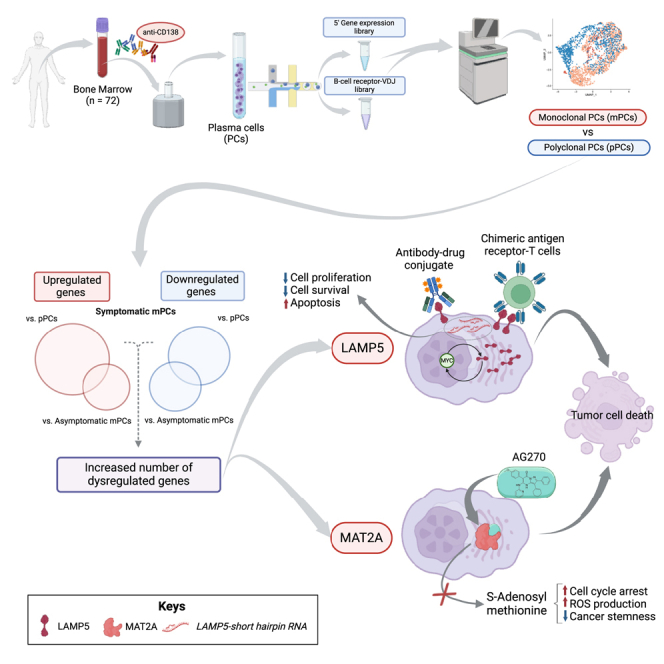
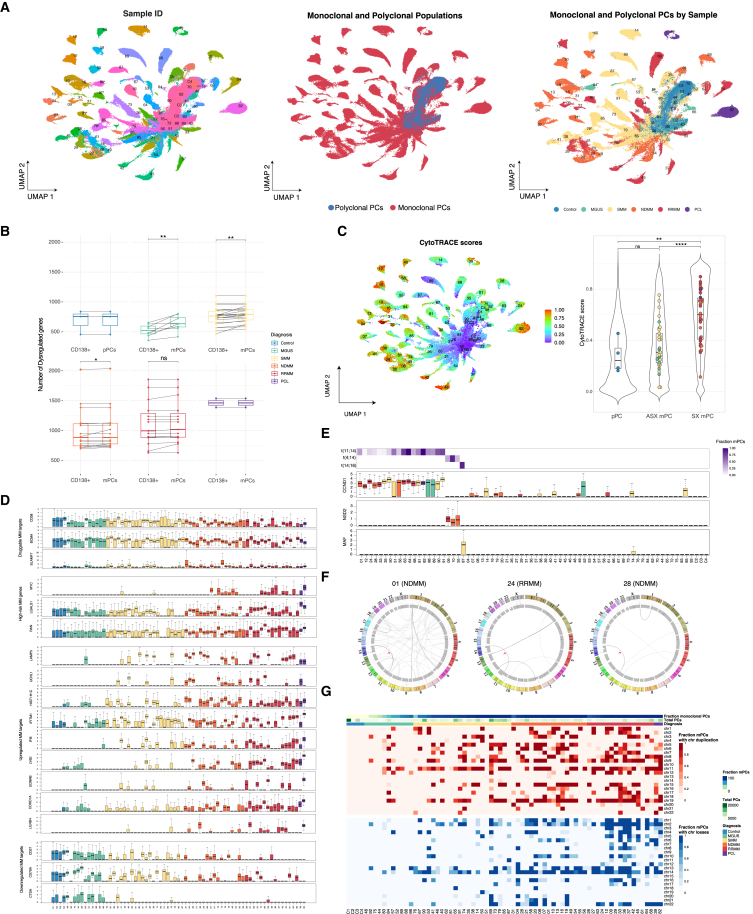
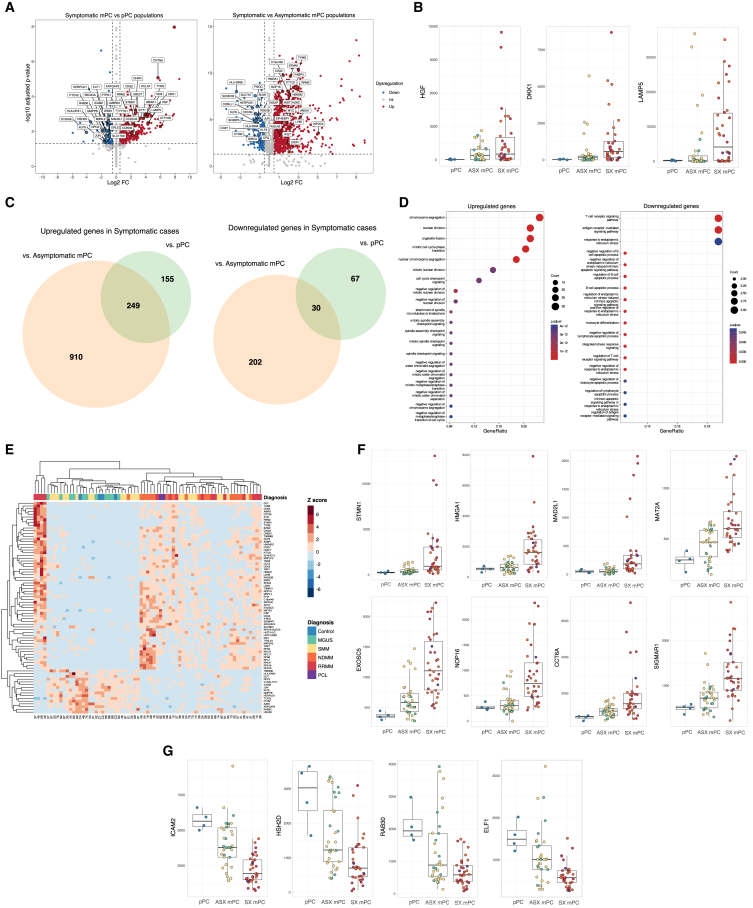
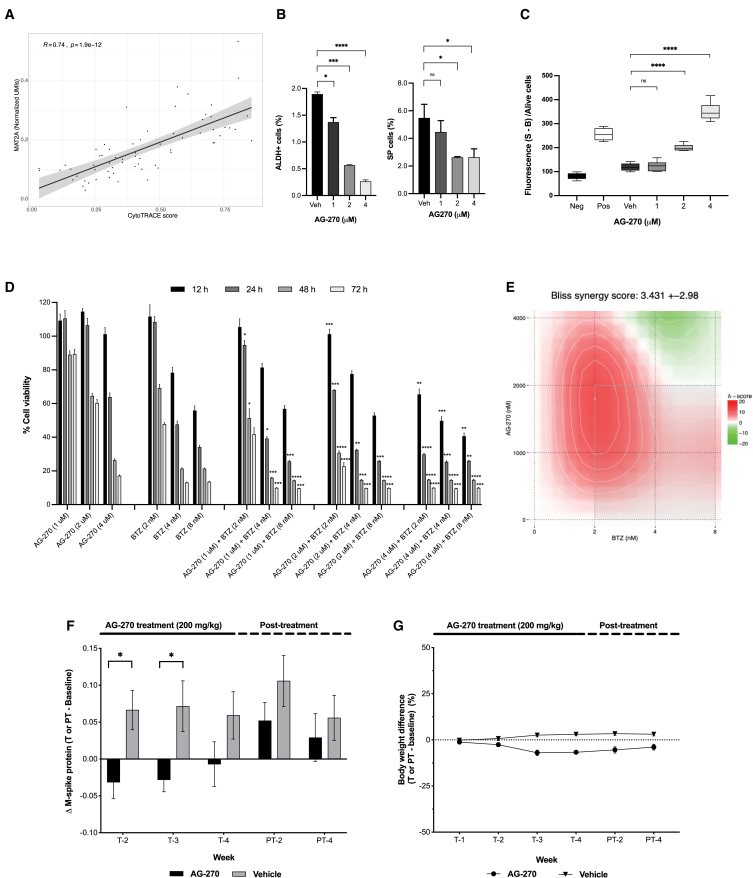
Multiple myeloma is a clonal plasma cell (PC) dyscrasia that arises from precursors and has been studied utilizing approaches focused on CD138+ cells. By combining single-cell RNA sequencing (scRNA-seq) with scB-cell receptor sequencing (scBCR-seq), we differentiate monoclonal/neoplastic from polyclonal/normal PCs and find more dysregulated genes, especially in precursor patients, than we would have by analyzing bulk PCs. To determine whether this approach can identify oncogenes that contribute to disease pathobiology, mitotic arrest deficient-2 like-1 (MAD2L1) and S-adenosylmethionine synthase isoform type-2 (MAT2A) are validated as targets with drug-like molecules that suppress myeloma growth in preclinical models. Moreover, functional studies show a role of lysosomal-associated membrane protein family member-5 (LAMP5), which is uniquely expressed in neoplastic PCs, in tumor progression and aggressiveness via interactions with c-MYC. Finally, a monoclonal antibody recognizing cell-surface LAMP5 shows efficacy as an antibody-drug conjugate and in a chimeric antigen receptor-guided T-cell format. These studies provide additional insights into myeloma biology and identify potential targeted therapeutic approaches that can be applied to reverse myeloma progression.

Keywords: LAMP5; MAT2A; disease progression; myeloma precursors; scBCR-seq; scRNA-seq.


Conflict of interest statement

Declaration of interests H.C.L. has provided consultancy services to AbbVie, Bristol Myers Squibb, Genentech, Janssen, Regeneron, GlaxoSmithKline, Sanofi, Takeda Pharmaceuticals, and Allogene Therapeutics and has received research funding from Amgen, Bristol Myers Squibb, Janssen, GlaxoSmithKline, Regeneron, and Takeda Pharmaceuticals. K.K.P. declares research support from Celgene, a wholly owned subsidiary of Bristol Myers Squibb. R.Z.O. declares research funding unrelated to this work from Heidelberg Pharma AG, Asylia Therapeutics, and Biotheryx. Also, R.Z.O. has served on advisory boards for Amgen, Inc., Bristol Myers Squibb, Celgene, EcoR1 Capital LLC, Forma Therapeutics, Genzyme, GSK Biologicals, Ionis Pharmaceuticals, Inc., Janssen Biotech, Juno Therapeutics, Kite Pharma, Legend Biotech USA, Molecular Partners, Sanofi-Aventis, Servier, and Takeda Pharmaceuticals North America, Inc. and is a founder of Asylia Therapeutics, Inc., with an equity interest. R.Z.O., D.E.S., H.W., and L.Y.M.R. declare a provisional patent application around the anti-LAMP5 antibody discussed herein.

Figures

None
Graphical abstract
Figure 1
Figure 1
Identification of mPCs and pPCs in primary samples (A) Overview of the workflow to analyze single-cell data from patient-derived PCs. (B) Barplot showing the mPC and pPC fractions (left) and the UMAP (right) based on the single-cell transcriptome of each PC population of a representative sample (case 27). Red represents mPCs and blue pPCs. (C) Boxplot of the mPC (left) and pPC (right) fractions identified in each category of diagnoses (controls: 3, MGUS: 13, SMM: 22, NDMM: 17, RRMM: 15, and PCL: 2 samples). ∗ indicates p ≤ 0.05; ∗∗p ≤ 0.01; ∗∗∗p ≤ 0.001; ∗∗∗∗p ≤ 0.0001; and n.s. non-significant differences, as determined by the Wilcoxon test. (D) Scatterplot (left) and Bland-Altman analysis (right) of the correlation between the number of myeloma PCs identified by flow and scRNA-seq based on BCR expression. Sample distribution is as in (C). The correlation (R) was assessed using the Spearman test. (E) Heatmap of inferred CNAs identified in a representative RRMM sample (case 27) with a random mixed pPC population from non-myeloma samples, with red representing inferred chromosomal gains, and blue losses. (F) Barplot of the total number of PCs color coded by diagnosis (top) and fraction of pPCs and mPCs with/without inferred CNAs (bottom) in each sample. Sample distribution is as in (C).
Figure 2
Figure 2
Inter-patient heterogeneity (A) UMAPs representing scRNA-seq data from enriched PCs from all patients with color codes representing unique samples (left), mPC and pPC populations (middle), and mPCs and pPCs by diagnosis (right). (B) Number of genes detected as dysregulated with a log2 FC of ≥ 0.5 or ≤ −0.5 when the analysis was conducted using all CD138+ PCs, or CD138+ mPCs from each sample identified by scBCR-seq, using “FindAllMarkers” in Seurat. Horizontal lines indicate little to no difference in the number of DEGs, while upward lines indicate more DEGs found when the analysis focused only on the mPCs. ∗ indicates p ≤ 0.05; ∗∗p ≤ 0.01; ∗∗∗p ≤ 0.001; ∗∗∗∗p ≤ 0.0001; and n.s. non-significant differences, as determined by the Wilcoxon test. (C) UMAP based on the single-cell transcriptome of a downsampled Seurat object with a color code of CytoTRACE score (left), and a superplot of the mean CytoTRACE score per sample group by diagnosis (right). Statistical testing was performed as in (B). (D) Boxplot of normalized UMIs detected in each sample, color coded by diagnosis, including myeloma-related markers, and commonly up- and down-regulated markers. (E) Heatmap of the fraction of PCs with myeloma IGH translocations detected by FISH (top), and boxplots of normalized UMIs of associated oncogene expression levels (next three rows). (F) Circos plots of three t(11;14)+ myelomas evaluated by Lumpy using WGS data from germline and tumor-matched samples. (G) Heatmap of the fraction of cells with inferred large chromosomal gains (red) or losses (blue) in each PC population organized by diagnosis. Total number of PCs isolated and the fraction of mPCs in each sample are represented at the top. These plots include a dataset of pPC samples (n = 4), and mPCs from patients with MGUS (n = 11), SMM (n = 22), NDMM (n = 17), RRMM (n = 15), and PCL (n = 2).
Figure 3
Figure 3
Dysregulated genes associated with disease progression in myeloma (A) Volcano plots of DEGs between mPC versus pPC populations from symptomatic myeloma (left), and versus mPCs from asymptomatic myeloma (right). Significant DEGs (false discovery rate [FDR] ≤ 0.05) are shown in red (up-regulated) or blue (down-regulated). (B) Boxplots of normalized pseudocounts of HGF, DKK1, and LAMP5 per mPC and pPC population grouped by diagnosis. (C) Venn diagram of the number of up-regulated (left) or down-regulated (right) genes in symptomatic mPC populations. (D) Dot plot of GO terms enriched in the up-regulated (left) and down-regulated (right) genes in symptomatic mPCs. (E) Heatmap of the common DEGs identified exclusively in mPCs from symptomatic patients. (F) Boxplots of normalized pseudocounts of the top up-regulated genes in symptomatic myeloma mPC populations grouped by diagnosis across the cohort. (G) Boxplots of normalized pseudocounts of the top down-regulated genes identified in symptomatic mPC populations grouped by diagnosis across the cohort. These plots include a dataset of pPC samples (n = 4), and mPCs from asymptomatic (ASX) (n = 33) and symptomatic (SX) (n = 34) patients.
Figure 4
Figure 4
Targeting MAD2L1 and MAT2A in myeloma cells (A) Effect of M2I-1 over 24–72 h on viability of the indicated myeloma cell lines evaluated with WST-1. (B) Effect of AG-270 over 24–72 h on viability in these cell lines evaluated with WST-1. (C) SAM concentration after exposure to vehicle or AG-270 for 12–72 h in ANBL-6 cells. (D) Cell cycle distribution in ANBL-6 cells treated with AG-270 and analyzed by flow after PI staining. (E) Induction of apoptosis (Annexin V+/PI) and necrosis (Annexin V+/PI+) in ANBL-6 cells after AG-270. (F) Induction of apoptosis by AG-270 as measured by western blotting for cleaved PARP and caspase-3 (top), as well as impact of AG-270 on histone H3 dimethylation (bottom). Error bars represent means ± SD from at least triplicate experiments. ∗ indicates p ≤ 0.05; ∗∗p ≤ 0.01; ∗∗∗p ≤ 0.001; ∗∗∗∗p ≤ 0.0001; and n.s. non-significant differences, as determined by the t test with Welch’s correction.
Figure 5
Figure 5
Pharmacodynamic and antitumor effects of AG-270 in myeloma (A) Correlation plot between the CytoTRACE scores in pPCs and mPCs from asymptomatic or symptomatic populations with mean MAT2A expression. The correlation (R) was assessed using the Spearman test. (B) Barplot of the impact of MAT2A inhibition with AG-270 on stem-like cells defined by ALDH positivity (left) or as the SP (right) in ANBL-6 cells. (C) ROS levels in the setting of AG-270 treatment, with pyocyanin- and N-acetyl-L-cysteine-treated cells serving as positive and negative controls, respectively, in ANBL-6 cells. (D) Impact on viability of ANBL-6 cells simultaneously treated with AG-270 (1–4 μM) and bortezomib (2–8 nM) over 12–72 h as measured with WST-1. (E) Combinatorial effect of AG-270 and bortezomib analyzed using SynergyFinder. (F) Cohorts of Vκ∗MYC mice (n = 12 each) were treated daily for 4 weeks with vehicle or AG- 270 (200 mg/kg), followed by observation. Serum obtained at the indicated time points was separated by electrophoresis, and disease burden was measured by densitometry to determine the monoclonal (M) protein, represented as (M-protein [treatment or post-treatment]/albumin) – (M-protein [baseline]/albumin). (G) Body weight changes during and after treatment with AG-270. Error bars represent means ± SD from at least triplicate experiments. ∗ indicates p ≤ 0.05; ∗∗p ≤ 0.01; ∗∗∗p ≤ 0.001; ∗∗∗∗p ≤ 0.0001; and n.s. non-significant differences, as determined by the t test with Welch’s correction.
Figure 6
Figure 6
Role of LAMP5 in MM tumorigenesis (A) ATRA reduces LAMP5 levels in myeloma cell lines. (B) Impact of ATRA on colony formation in JJN3 and MM1.S cells previously sorted into high (top 5%) and low (bottom 5%) LAMP5 expression. (C) BET protein depletion using ARV-825 and the expression levels of c-MYC and LAMP5 determined by western blotting of MM1.S or JJN3 cells. (D) ChIP with control antibodies (anti-IgG), or antibodies to RNA polymerase II (Pol 2) or c-MYC followed by amplification for sequences near the LAMP5 promoter. (E) 293T cells were co-transfected with vectors expressing a LAMP5 promoter-luciferase reporter and with one of two different concentrations of a vector expressing c-MYC, or the individual constructs or an empty vector control. Dual-luciferase assays were performed to determine LAMP5 promoter activity. (F) Protein-protein interaction network analysis using the common DEGs linked to LAMP5 knockdown performed using the StringApp in Cytoscape. (G) Heatmap of the normalized intensity of dysregulated proteins associated with LAMP5 knockdown in MM1.S cells based on proteomic studies performed by reverse-phase protein array (RPPA). Error bars represent means ± SD from at least triplicate experiments. ∗ indicates p ≤ 0.05; ∗∗p ≤ 0.01; ∗∗∗p ≤ 0.001; ∗∗∗∗p ≤ 0.0001; and n.s. non-significant differences, as determined by the t test with Welch’s correction.
Figure 7
Figure 7
Efficacy of targeting LAMP5 in vitro and in vivo (A) Impact on viability of MM1.S cells exposed to unconjugated IgG2A or C17 antibody, versus IgG2A-MMAE, IgG2A-tesirine, C17-MMAE, and C17-tesirine for 72 h. Median inhibitory concentrations (IC50) are shown. Error bars represent means ± SEM from at least triplicate experiments for this and subsequent panels. (B) Impact on viability of NCI-H929 myeloma cells exposed to the treatments detailed above for 72 h. (C) Effect of CAR-T cells (LAMP5.1 and LAMP5.2) developed based on the C17 sequence on viability of LAMP5 RPMI-8226 cells with a vector control or the same cell line harboring a LAMP5 expression vector (LAMP5+). BCMA-targeted CAR-T cells are a positive control, while a non-targeting CAR construct (NC) is the negative control. Statistical analysis was performed using the t test with Welch’s correction. (D) Effect of LAMP5-targeting CAR-T cells on viability of native LAMP5+ NCI-H929 cells using increasing E:T ratios. Statistical test was performed as in (C). (E) Bioluminescence-based tumor quantification in an MM1.S-based xenograft in immunodeficient mice treated once with IgG2A-tesirine or C17-tesirine (1 mg/kg) compared to a vehicle (PBS) control (n = 10/group). Statistical analysis was performed using the Mann-Whitney test. (F) Survival curve of the previous mouse model treated once with C17- or IgG2A-tesirine (1 mg/kg) or vehicle for 6 months. Statistical analysis was performed using the log rank Mantel-Cox test. ∗ indicates p ≤ 0.05; ∗∗p ≤ 0.01; ∗∗∗p ≤ 0.001; ∗∗∗∗p ≤ 0.0001; and n.s. non-significant differences.

References

    1. Institute N.C. 2024. Cancer Stat Facts: Myeloma. https://seer.cancer.gov/statfacts/html/mulmy.html.
    1. Sawyer J.R., Waldron J.A., Jagannath S., Barlogie B. Cytogenetic findings in 200 patients with multiple myeloma. Cancer Genet. Cytogenet. 1995;82:41–49. doi: 10.1016/0165-4608(94)00284-i. - DOI - PubMed
    1. Bergsagel P.L., Chesi M., Nardini E., Brents L.A., Kirby S.L., Kuehl W.M. Promiscuous translocations into immunoglobulin heavy chain switch regions in multiple myeloma. Proc. Natl. Acad. Sci. USA. 1996;93:13931–13936. doi: 10.1073/pnas.93.24.13931. - DOI - PMC - PubMed
    1. Chapman M.A., Lawrence M.S., Keats J.J., Cibulskis K., Sougnez C., Schinzel A.C., Harview C.L., Brunet J.P., Ahmann G.J., Adli M., et al. Initial genome sequencing and analysis of multiple myeloma. Nature. 2011;471:467–472. doi: 10.1038/nature09837. - DOI - PMC - PubMed
    1. Bolli N., Avet-Loiseau H., Wedge D.C., Van Loo P., Alexandrov L.B., Martincorena I., Dawson K.J., Iorio F., Nik-Zainal S., Bignell G.R., et al. Heterogeneity of genomic evolution and mutational profiles in multiple myeloma. Nat. Commun. 2014;5:2997. doi: 10.1038/ncomms3997. - DOI - PMC - PubMed

Substances