

Identification the Cellular Senescence Associated lncRNA LINC01579 in Gastric Cancer
- PMID: 39855898
- PMCID: PMC11760997
- DOI: 10.1111/jcmm.70360
Identification the Cellular Senescence Associated lncRNA LINC01579 in Gastric Cancer
Abstract
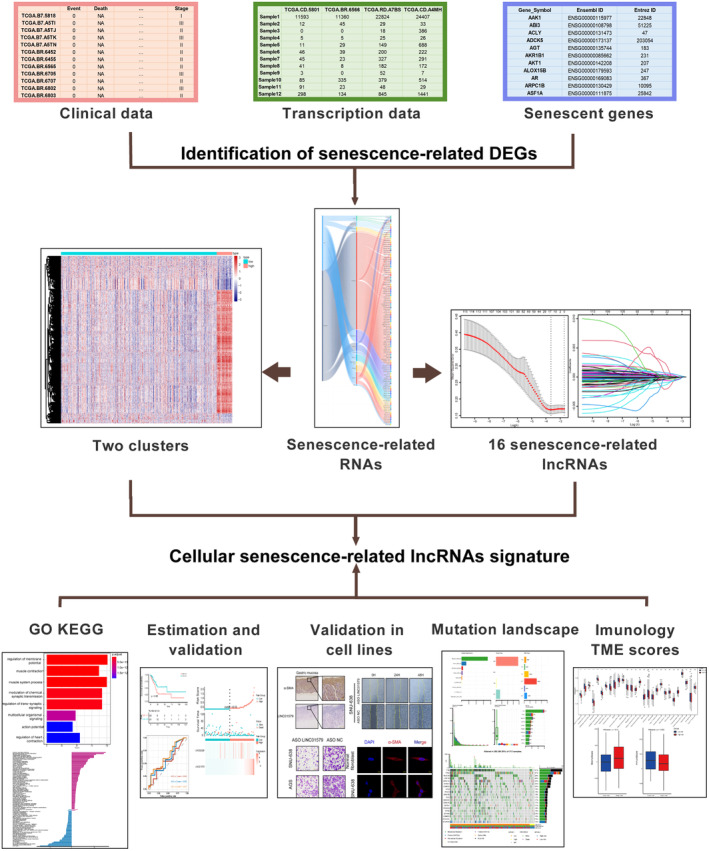
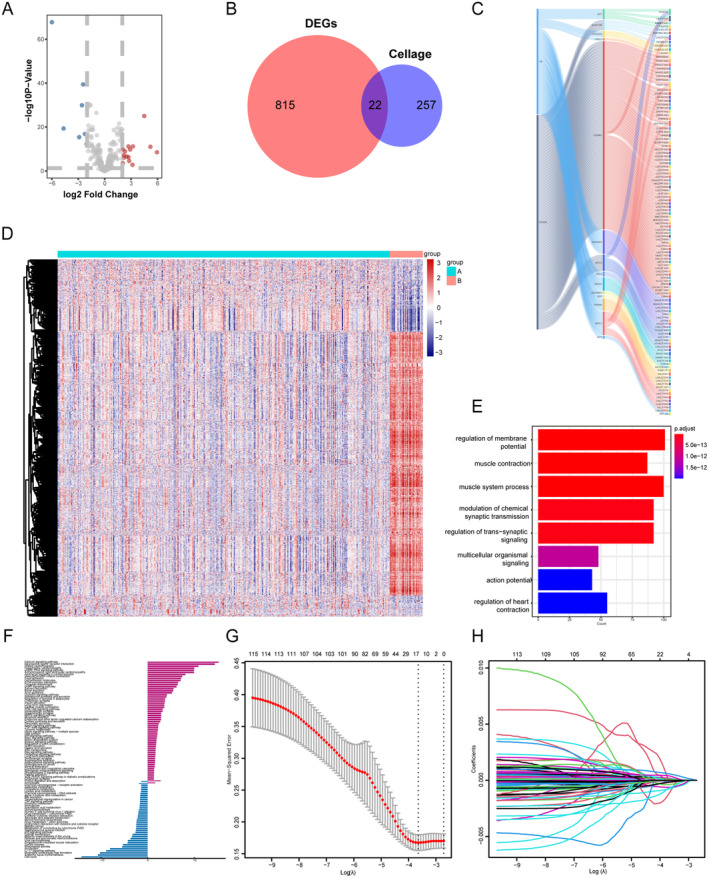
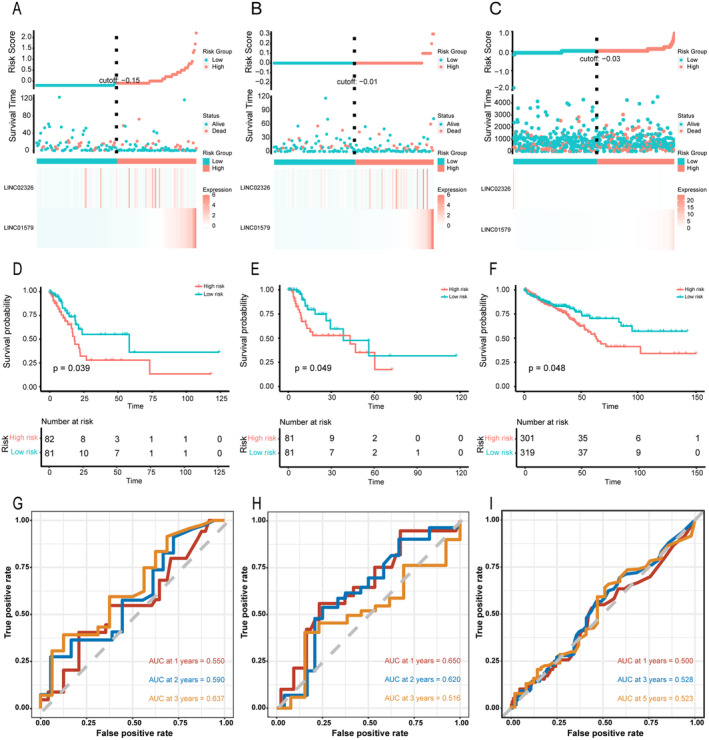
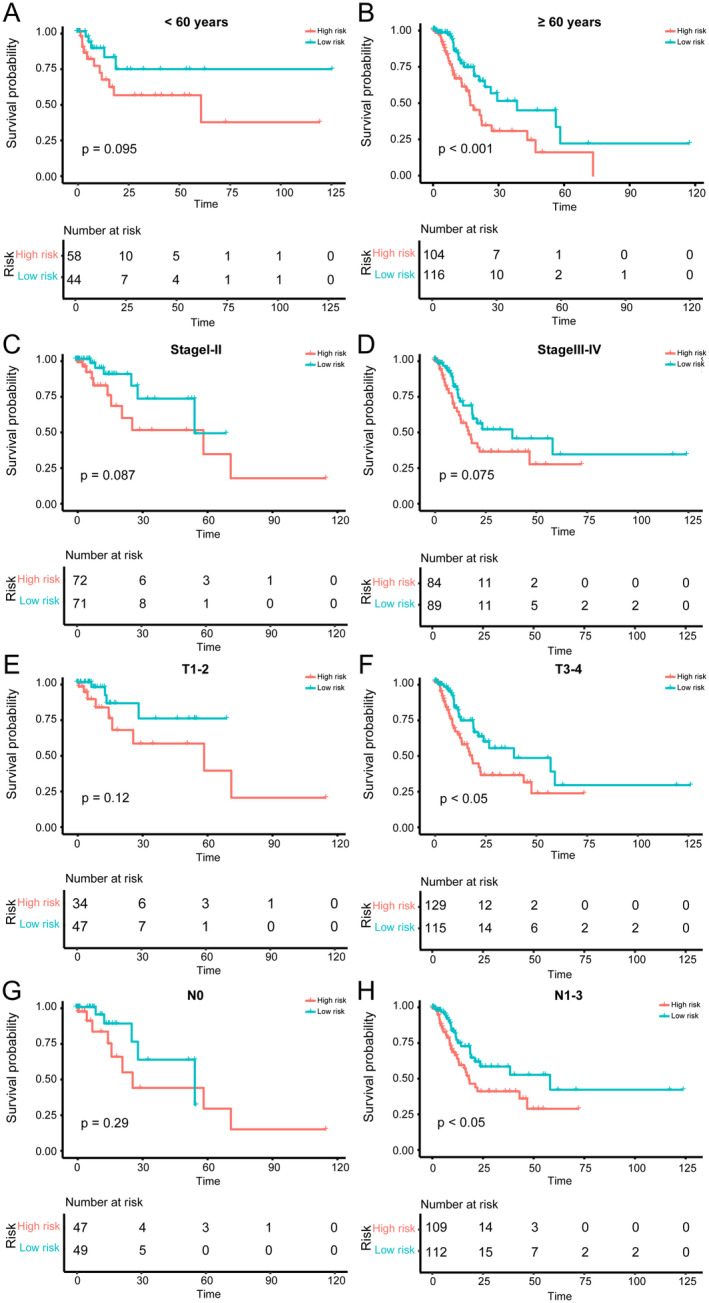
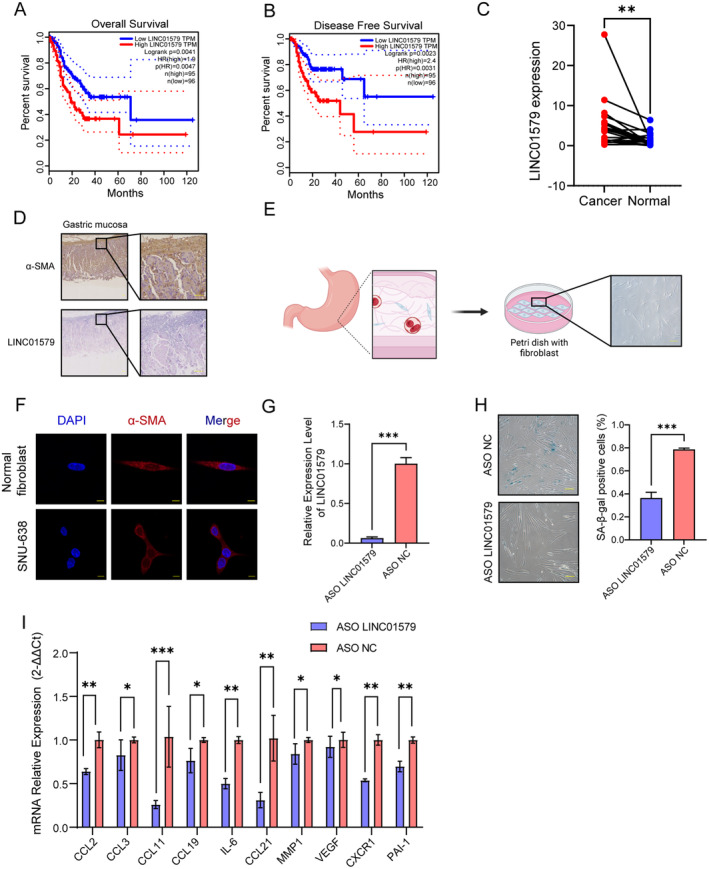
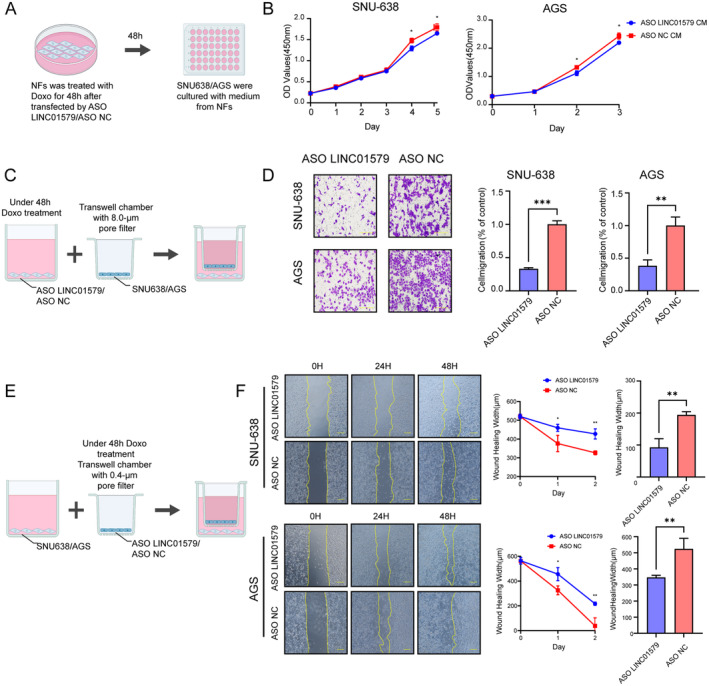
Cellular senescence is a key promoter of tumorigenesis and malignant progression. This study aimed to develop a predictive model for assessing cellular senescence in gastric cancer (GC) outcomes. We identified senescence-related genes and lncRNAs from 375 stomach adenocarcinoma (STAD) patients and established a prognostic senescence score using multivariate Cox regression, validated in testing, TCGA-STAD and the combined TCGA-COAD and READ cohorts. The model's predictive efficacy was evaluated across clinical subgroups, tumour microenvironments and immune cell infiltration. A total of 116 senescence-related lncRNAs were filtered, and patients were clustered into two senescent subtypes. The lncRNA signature identified LINC01579 as an independent prognostic factor for GC. Low-risk groups showed prolonged overall survival, increased immune cell infiltration and reduced mutation load. Downregulation of LINC01579 using antisense oligonucleotides (ASOs) on normal human fibroblasts decreased cellular proliferation and migration in GC. Collectively, this study established and validated a promising prognostic model connecting senescence-related lncRNAs and clinical outcome in GC and provided potential senescence-related biomarkers for GC prognosis prediction.
Keywords: cellular senescence; fibroblast; gastric cancer; prognosis; tumour microenvironment.
© 2025 The Author(s). Journal of Cellular and Molecular Medicine published by Foundation for Cellular and Molecular Medicine and John Wiley & Sons Ltd.
Conflict of interest statement
The authors declare no conflicts of interest.
Figures

Similar articles
-
The necroptosis-related signature and tumor microenvironment immune characteristics associated with clinical prognosis and drug sensitivity analysis in stomach adenocarcinoma.Aging (Albany NY). 2024 Mar 27;16(7):6098-6117. doi: 10.18632/aging.205690. Epub 2024 Mar 27. Aging (Albany NY). 2024. PMID: 38546403 Free PMC article.
-
Unveiling a novel model of cell senescence-related genes for prognostic assessment and immunotherapeutic insights in gastric cancer.Sci Rep. 2025 Feb 12;15(1):5251. doi: 10.1038/s41598-025-89369-3. Sci Rep. 2025. PMID: 39939808 Free PMC article.
-
Prognostic prediction and immune infiltration analysis based on lysosome and senescence state identifies MMP12 as a novel therapy target in gastric cancer.Int Immunopharmacol. 2024 Dec 25;143(Pt 1):113344. doi: 10.1016/j.intimp.2024.113344. Epub 2024 Oct 13. Int Immunopharmacol. 2024. PMID: 39401475
-
Immune Infiltration Subtypes Characterization and Identification of Prognosis-Related lncRNAs in Adenocarcinoma of the Esophagogastric Junction.Front Immunol. 2021 May 28;12:651056. doi: 10.3389/fimmu.2021.651056. eCollection 2021. Front Immunol. 2021. PMID: 34122409 Free PMC article.
-
Identification of novel key regulatory lncRNAs in gastric adenocarcinoma.BMC Genomics. 2022 May 7;23(1):352. doi: 10.1186/s12864-022-08578-6. BMC Genomics. 2022. PMID: 35525925 Free PMC article. Review.
Cited by
-
Cellular senescence in cancer: from mechanism paradoxes to precision therapeutics.Mol Cancer. 2025 Aug 8;24(1):213. doi: 10.1186/s12943-025-02419-2. Mol Cancer. 2025. PMID: 40781676 Free PMC article. Review.
References
-
- Sung H., Ferlay J., Siegel R. L., et al., “Global Cancer Statistics 2020: GLOBOCAN Estimates of Incidence and Mortality Worldwide for 36 Cancers in 185 Countries,” CA: A Cancer Journal for Clinicians 71 (2021): 209–249. - PubMed
-
- Hernandez‐Segura A., Nehme J., and Demaria M., “Hallmarks of Cellular Senescence,” Trends in Cell Biology 28 (2018): 436–453. - PubMed
-
- Calcinotto A., Kohli J., Zagato E., Pellegrini L., Demaria M., and Alimonti A., “Cellular Senescence: Aging, Cancer, and Injury,” Physiological Reviews 99 (2019): 1047–1078. - PubMed
MeSH terms
Substances
Grants and funding
- 2020B121201004/Guangdong Provincial Key Laboratory of Precision Medicine for Gastrointestinal Cancer
- 2021C004/President Foundation of Nanfang Hospital, Southern Medical University
- 2022A1515110992/Basic and Applied Basic Research Foundation of Guangdong Province
- 2021A1515110133/Basic and Applied Basic Research Foundation of Guangdong Province
- 2023B1111050009/Key Areas Research and Development Programs of Guangdong Province
LinkOut - more resources
Full Text Sources
Medical
Miscellaneous
