. 2025 Jan 24;16(1):971.
doi: 10.1038/s41467-025-56193-2.

Specific types of male infertility are correlated with T cell exhaustion or senescence signatures

Affiliations

Specific types of male infertility are correlated with T cell exhaustion or senescence signatures

Giada Amodio et al. Nat Commun. .

Abstract

The association between male infertility and health status has yet to be unraveled. Here, by combining multiparameter phenotyping and scRNA-seq, we delineate the immune status of infertile men both at the semen and systemic levels. We first observe that young infertile men have a pro-inflammatory milieu with increased frequency of myeloid cells and inflammatory mediators in the seminal fluid and the peripheral blood, which are immune alterations typically observed in healthy elderly men. Transcriptomic profiling confirms the upregulation of genes associated with the interferon-gamma and -alpha responses in peripheral blood T cells of infertile men with oligo-astheno-teratozoospermia or non-obstructive azoospermia, with distinct T cell signatures of exhaustion and senescence discriminating the two infertile conditions. These findings provide evidence that subtypes of male infertility are characterized by specific immune signatures and unravel the potential link between infertility and the risk of developing secondary diseases.


Conflict of interest statement

Competing interests: The authors declare no competing interests.

Figures
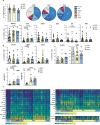
Fig. 1
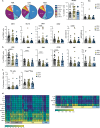
Fig. 1. Pro-inflammatory environment in the semen of severe infertile patients.
ab The proportion of the major leukocyte subsets, including dendritic cells (DC), was analyzed by multiparametric flow cytometry in the sperm fluid of fertile (FER), Oligo-Astheno-Terato spermia (OAT), and non-obstructive azoospermia (NOA) men. a Absolute cell count of CD45+ cells and pie charts showing the overall leukocyte subset distribution in FER (n = 28), OAT (n = 35), and NOA (n = 8) men; numbers in pie charts indicate the mean, *P ≤ 0.05 and **P ≤ 0.01 vs FER. Lower panels show the distribution of each leukocyte population in the different groups; each dot represents a single donor, scatter plots indicate mean ± SEM; Kruskal-Wallis test in association with Dunn’s multiple comparison test was used to determine the statistical significance of the data, statistically significant P values are reported. b The proportion of DC-10 (CD11c+CD14+CD16+CD141+CD163+), cDC1 (CD14-CD11c+CD141+), and cDC2 (CD11c+CD1c+) in the sperm fluid of FER (n = 10), OAT (n = 25), and iNOA (n = 8) men; the percentage of DC-10 expressing HLA-G and CD83, and the ratio between the percentage of cDC1 and DC-10 and of cDC2 and DC-10 calculated for each donor are shown. Each dot represents a single donor; scatter plots indicate mean ± SEM; the Kruskal-Wallis test, in association with Dunn’s multiple comparison test, was used to determine the statistical significance of the data, and statistically significant P values are reported. c The presence and concentration of cytokines and chemokines were evaluated using multi-beads array in sperm plasma of fertile men without (nFER, n = 8) or with one/two spermiogram alterations (aFER, n = 17), OAT (n = 32), and NOA (n = 7) men. All the analytes tested were divided into different heatmaps according to their concentration (pg/ml); in each heatmap, cytokines/chemokines are ordered based on their abundance. Heat map color corresponds to the real concentration values being the spectrum of blue to green to yellow corresponding to increasing gradient of chemokine/cytokine concentrations. Values above the standard range are reported in orange. Source data are provided as a Source Data file.
Fig. 2
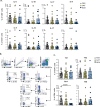
Fig. 2. Systemic pro-inflammatory signature in severe infertile men.
ab The proportion of the major leukocyte subsets and regulatory T cells was analyzed by multiparametric flow cytometry in peripheral blood of fertile (FER, n = 33), Oligo-Astheno-Terato spermia (OAT, n = 34), and non-obstructive azoospermia (NOA, n = 12) men. a Pie charts showing the overall leukocyte subset distribution in FER, OAT, and NOA men; numbers in pie charts indicate the mean, *P ≤ 0.05 and ***P ≤ 0.001 vs. FER; scatter plot (mean ± SEM) showing the proportion of the indicated myeloid cell subsets in FER (n = 29), OAT (n = 34), and NOA (n = 12) men and the ratio between the percentage of cDC1 and DC-10 and between the percentage of cDC2 and DC-10 calculated for each donor is presented; each dot represents a single donor; Kruskal-Wallis test in association with Dunn’s multiple comparison test were used to determine the statistical significance of the data, statistically significant P values are reported. b The frequencies of the indicated lymphoid cell subsets, including T regulatory type 1 (Tr1, CD4+CD45RA-CD49b+LAG-3+) and FOXP3+ Treg (CD4+CD25+CD127-FOXP3+) cells in the peripheral blood of FER (n = 33), OAT (n = 31), and NOA (n = 12) men are shown; each dot represents a single donor, scatter plots indicate mean ± SEM; Kruskal-Wallis test in association with Dunn’s multiple comparison test were used to determine the statistical significance of the data. c The frequencies of T regulatory type 1 (Tr1, CD4+CD45RA-CD49b+LAG-3+) and FOXP3+ Treg (CD4+CD25+CD127-FOXP3+) cells in the indicated cohort of donors are shown; each dot represents a single donor, scatter plots indicate mean ± SEM; Kruskal-Wallis test in association with Dunn’s multiple comparison test were used to determine the statistical significance of the data. d The presence and concentration of cytokines and chemokines were evaluated using a multi-beads array in plasma from peripheral blood of fertile men without (nFER, n = 9) or with one/two spermiogram alterations (aFER, n = 18), OAT (n = 32), and NOA (n = 11) men. All the analytes tested were divided into two different heatmaps according to their concentration (pg/ml); in each heatmap, cytokines/chemokines are ordered based on their abundance. Heat map color corresponds to the real concentration values, the spectrum of blue to green to yellow, corresponding to an increasing gradient of chemokine/cytokine concentrations. Values above the standard range are reported in orange. Source data are provided as a Source Data file.
Fig. 3
Fig. 3. Characterization of peripheral T cells from infertile and fertile men.
a The proportion of circulating CD4+ and CD8+ T cells expressing the indicated activation and inhibitory markers was analyzed by multiparametric flow cytometry in the peripheral blood of fertile (FER, n = 31), Oligo-Astheno-Terato spermia (OAT, n = 33), and non-obstructive azoospermia (NOA, n = 11) men; bar plots indicate mean ± SEM; Kruskal-Wallis test in association with Dunn’s multiple comparison test were used to determine the statistical significance of the data; statistically significant P values are reported. bc. The proliferative capacity and cytokine production of CD3+ T cells from FER (n = 25/n = 18), OAT (n = 30/n = 22), and NOA (n = 10/n = 10) men in response to different stimuli were tested. b PBMC were labeled with proliferation dye and left unstimulated or stimulated with anti-CD3 mAb (upper panels) or phytohaemagglutinin (PHA) (lower panels) for four days. The percentage of proliferated cells was evaluated as the percentage of cells that diluted the dye; proliferation index (PI) represents the ratio between the percentage of CD4+ and of CD8+ T cells proliferated in the stimulated condition/percentage of proliferated cells in the unstimulated condition. At the end of the stimulation, culture supernatants were collected and the presence of IFNγ, IL-10, and GM-CSF was evaluated by ELISA; each dot represents a single donor, scatter plots indicate mean ± SEM; Kruskal-Wallis test in association with Dunn’s multiple comparison test were used to determine the statistical significance of the data; statistically significant P values are reported. c PBMC were activated with phorbol 12-myristate 13-acetate/Ionomycin (PMA/IONO) for 6 h; the percentages of CD4+ and CD8+ T cells producing IFN-g and IL-2 were evaluated by multiparametric flow cytometry; each dot represents a single donor, scatter plots indicate mean ± SEM; Kruskal-Wallis test in association with Dunn’s multiple comparison test were used to determine the statistical significance of the data. Source data are provided as a Source Data file.
Fig. 4
Fig. 4. Cytokine production of peripheral blood CD4+ and CD8+ T cells from infertile and fertile individuals.
The ability to produce cytokines of CD3+ T cells in response to phorbol 12-myristate 13-acetate/Ionomycin (PMA/IONO) stimulation was evaluated by multiparametric flow cytometry. PBMC were isolated from fertile (FER, n = 25), Oligo-Astheno-Terato spermia (OAT, n = 30), and non-obstructive azoospermia (NOA, n = 10) men and activated for 6 h. a The percentage of CD8+ and CD4+ T cells producing the indicated cytokines is shown. Each dot represents a single donor, scatter plots indicate mean ± SEM; Kruskal-Wallis test in association with Dunn’s multiple comparison test were used to determine the statistical significance of the data. bc The frequency of T helper subsets was evaluated in PBMC stimulated with PMA/IONO. b Representative gating strategy used to identify the frequencies of Th1 (CD4+IL-4-IL-17-IFNg+), Th9 (CD4+IL-4-IL-17-IFNg-IL-9+), Th2 (CD4+IL-17-IFNg-IL-4+), and of Th17 (CD4+IL-4-IFNg-IL-17+) cell subsets; numbers indicate the percentage relative to the CD4+CD3+ gate. c Frequency of the indicated Th cell subsets among the three groups. Each dot represents a single donor; scatter plots indicate mean ± SEM; the Kruskal-Wallis test, in association with Dunn’s multiple comparison tests, was used to determine the statistical significance of the data, and statistically significant P values are reported. Source data are provided as a Source Data file.
Fig. 5
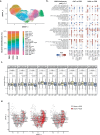
Fig. 5. Pro-inflammatory transcriptional profile of infertile men peripheral blood T cells.
a Uniform manifold approximation and projection (UMAP) embeddings of 45622 single cells from single-cell RNA-sequencing (scRNA-seq) analysis performed on CD3+ T cells isolated from peripheral blood of fertile (FER, n = 5), Oligo-Astheno-Terato spermia (OAT, n = 4), and non-obstructive azoospermia (NOA, n = 6) men, showing the formation of 18 clusters with the respective labels indicated in the color legend. Each dot corresponds to a single cell, colored by unsupervised clustering (resolution 1.2) (upper panel). Bar plots showing the distribution of each T-cell cluster in the indicated group of men (lower panel). b Tile plot of normalized enrichment scores (NES) from gene set enrichment analysis (GSEA) of hallmark terms on differentially expressed genes (DEG) between OAT or NOA and FER men within the indicated clusters; hallmarks (rows) are grouped by semantic similarity; columns represent single-cluster comparisons between the specified conditions; non-significant enrichment results are plotted in light gray [Benjamini–Hochberg adjusted P value (padj) >0.1]. cd Transcriptomic analysis of the activation status of the differentiated/effector T cell clusters. c Box plots of the activation score across different clusters and conditions; horizontal lines represent median values, with whiskers extending to the farthest data point within a maximum of 1.5X interquartile range; one-way ANOVA for the comparison of the groups and two-sided T test for the pairwise comparisons were applied; P values from all the comparisons are reported. d UMAP representation of cells tested for the activation score in FER (n = 3226 cells), OAT (n = 9905 cells), and NOA (n = 9541 cells) condition; cells are colored according to the expression of the activation score: gray for a score < 0.25, red for a score > 0.25; percentages of cells with a score > 0.25 are indicated for each condition (n = 83, n = 514, and n = 217 cells for FER, OAT, and NOA, respectively). Source data are provided in the Source Data file.
Fig. 6
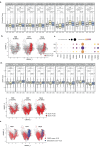
Fig. 6. Signatures of exhaustion and senescence distinguish T cells from OAT and NOA men.
Transcriptomic analysis of the exhaustion status of the more differentiated clusters of CD3+ T cells isolated from peripheral blood of fertile (FER, n = 5), Oligo-Astheno-Terato spermia (OAT, n = 4), and non-obstructive azoospermia (NOA, n = 6) men. a Box plots of the exhaustion score across different clusters and conditions; horizontal lines represent median values, with whiskers extending to the farthest data point within a maximum of 1.5X interquartile range; one-way ANOVA for the comparison of the groups and two-sided T test for the pairwise comparisons were applied; P values from all the comparisons are reported. b UMAP density plots of cells tested for the exhaustion score in FER (n = 3226 cells), OAT (n = 9905 cells), and NOA (n = 9541 cells) condition; cells are colored according to the expression of the exhaustion score: gray for a score < 0.25, red for a score > 0.25; percentages of cells with a score > 0.25 are indicated for each condition (n = 35, n = 522, and n = 205 cells for FER, OAT, and NOA, respectively). c Dot plot showing the expression of genes used to evaluate the exhaustion score across the three conditions; dot size indicates the percentage of cells expressing the queried gene (columns), color scale represents relative gene expression within each condition (rows). d Box plots of the Senescence-Associated Secretory Phenotype (SASP) score across different clusters and conditions; horizontal lines represent median values, with whiskers extending to the farthest data point within a maximum of 1.5X interquartile range; one-way ANOVA for the comparison of the groups and two-sided T test for the pairwise comparisons were applied; P values from all the comparisons are reported (upper panel). UMAP density plots of cells tested for the SASP score in FER (n = 3226 cells), OAT (n = 9905 cells), and NOA (n = 9541 cells) condition (lower panel); cells are colored according to the expression of the exhaustion score: gray for a score <0.25, red for a score > 0.25; percentages of cells with a score > 0.25 are indicated for each condition (n = 495, n = 1221, and n = 1712 cells for FER, OAT, and NOA, respectively). e UMAP representation of cells tested for the exhaustion and SASP score in FER, OAT, and NOA conditions; blue dots indicated cells with an exhaustion score > 0.25, and red dots indicated cells with an SASP score > 0.25. Source data are provided in the Source Data file.

References

    1. Boivin, J., Bunting, L., Collins, J. A. & Nygren, K. G. International estimates of infertility prevalence and treatment-seeking: potential need and demand for infertility medical care. Hum. Reprod.22, 1506–1512 (2007). - PubMed
    1. Ventimiglia, E. et al. Extensive assessment of underlying etiological factors in primary infertile men reduces the proportion of men with idiopathic infertility. Front Endocrinol. (Lausanne)12, 801125 (2021). - PMC - PubMed
    1. Minhas, S. et al. European association of urology guidelines on male sexual and reproductive health: 2021 update on male infertility. Eur. Urol.80, 603–620 (2021). - PubMed
    1. Schlegel, P. N. et al. Diagnosis and treatment of infertility in men: AUA/ASRM guideline part I. Fertil. Steril.115, 54–61 (2021). - PubMed
    1. Eisenberg, M. L. et al. Male infertility. Nat. Rev. Dis. Prim.9, 49 (2023). - PubMed

MeSH terms

Substances

Supplementary concepts

LinkOut - more resources