. 2025 Jan 24;16(1):1004.
doi: 10.1038/s41467-025-56248-4.

Stable laser-acceleration of high-flux proton beams with plasma collimation

Affiliations

Stable laser-acceleration of high-flux proton beams with plasma collimation

M J V Streeter et al. Nat Commun. .

Abstract

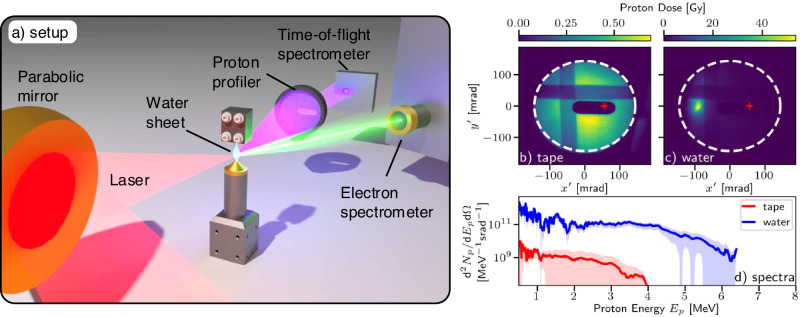
Laser-plasma acceleration of protons offers a compact, ultra-fast alternative to conventional acceleration techniques, and is being widely pursued for potential applications in medicine, industry and fundamental science. Creating a stable, collimated beam of protons at high repetition rates presents a key challenge. Here, we demonstrate the generation of multi-MeV proton beams from a fast-replenishing ambient-temperature liquid sheet. The beam has an unprecedentedly low divergence of 1° (≤20 mrad), resulting from magnetic self-guiding of the proton beam during propagation through a low density vapour. The proton beams, generated at a repetition rate of 5 Hz using only 190 mJ of laser energy, exhibit a hundred-fold increase in flux compared to beams from a solid target. Coupled with the high shot-to-shot stability of this source, this represents a crucial step towards applications.


Conflict of interest statement

Competing interests: The authors declare no competing interests.

Figures

Fig. 1
Fig. 1. Experimental setup and generated proton beams.
a Illustration of the experimental setup, showing the laser-water interaction and the primary diagnostics. Each laser pulse contained up to 200 mJ in a pulse length of (57 ± 5)fs (FWHM) and was focused to a focal spot waist of (1.2 × 1.4) μm2, giving a peak intensity of I0 = (3.5 ± 0.4) × 1019 W cm−2. The laser was focused onto a thin ((600 ± 100) nm) sheet of water generated by a converging nozzle geometry in a vacuum chamber. b Example proton dose distributions for the beams produced from single shots with the 12.7 μm thick Kapton tape target and c the water sheet using comparable laser settings and the same detector screen. The dashed white line highlights the edge of the scintillator screen and the horizontal and vertical stripes are due to aluminium filters which blocked lower energy protons. The dark oval was a hole in the scintillator screen permitting a line-of-sight for the time-of-flight (TOF) diode, as indicated by the red '+'. d The average proton spectra, recorded by the TOF diagnostic, were calculated from several shots at the same conditions as (b) (red—average of 20 shots) and (c) (blue—average of 50 shots). The spectra are normalised to peak flux observed on the scintillator screen. The solid lines show the average spectrum, while the shaded region shows the rms shot-to-shot variations.
Fig. 2
Fig. 2. Energy dependant proton beam spatial profiles.
a The observed dose profile for a single shot. The different filtered regions are labelled as 1) aluminised mylar filter plus 2–4) 10 μm, 20 μm and 30 μm of additional aluminium respectively. The peak energy deposition (Bragg peak) occurs for 1.1 MeV, 1.5 MeV, 1.9 MeV and 2.2 MeV protons in regions 1-4 respectively. The average energy of protons contributing to the signal in each region (weighted by the measured proton spectrum and relative dose deposition per particle) is 2.2 MeV, 2.8 MeV, 3.3 MeV and 3.6 MeV. The peak dose for each region was 50 Gy, 36 Gy, 32 Gy, 20 Gy respectively. b The flux of protons with Ep≥ 1 MeV inferred using the relative spectrum provided by the TOF spectrometer.
Fig. 3
Fig. 3. Proton beam stability at 5Hz operation.
a Measured dose profiles from 10 consecutive shots with the water sheet target and nominally identical conditions. The horizontal and vertical bands are created by aluminium filters as indicated by the dashed white lines. b, c The rms beam waists and centroids of 2D Gaussian fits to the unfiltered region of the proton spatial profile and (d) the peak dose observed for 300 consecutive shots. e The average proton spectrum as recorded by the TOF spectrometer. For (be) the standard deviation is indicated by the shaded region.
Fig. 4
Fig. 4. Proton and electron beam parameter scans.
a, d Waterfall plots showing individual proton spectra for automated scans of target position along the laser propagation axis zT and laser energy EL respectively. The spectra are taken in bursts of equal zT and EL, as indicated by the vertical dividing lines. The horizontal bands visible in the plots are due to spurious electrical noise in the diagnostic. The 95% percentile proton energies for each shot are overlaid as white dots. d also shows the predicted maximum proton energies from the best fitting EpEL1/2 scaling as horizontal white lines. b, e The total detected proton beam energy (left axis) and the detected electron charge (right axis) shown as the average and standard deviation of each burst. c, f The average electron spectra for shots at selected values of zT and EL. Positive values of zT correspond to the laser focusing before the target surface, while negative target positions correspond to the laser interacting with the target before reaching best focus. Note that the energy scan shown in (df) was taken for a slight defocus of zT ≈ 30 μm.
Fig. 5
Fig. 5. Proton focusing in particle-in-cell simulations.
Series of snapshots of (a) the proton beam density nb, b the water molecule ionisation state, c the azimuthal magnetic fields and d the proton beam transverse phase space as the proton beam propagates through the vapour. The progress of the proton beam in each snapshot is indicated by the z-axis (ac) and the text labels (d) (note that the bunch stretches longitudinally due to velocity dispersion). e, f Proton beam angular distributions as functions of the proton beam centroid position zb for propagation through vapour and vacuum respectively. Both plots are normalised to the same value to allow direct comparison. The red dashed vertical lines in (e) indicate the corresponding positions of the snapshots in (ad) and the blue line indicates the normalised water vapour density profile (scaled to the plot window), which had a maximum molecular density of 6 × 1017 cm−3.

References

    1. Snavely, R. et al. Intense high-energy proton beams from Petawatt-laser irradiation of solids. Phys. Rev. Lett.85, 2945–2948 (2000). - PubMed
    1. Fuchs, J. et al. Laser-driven proton scaling laws and new paths towards energy increase. Nat. Phys.2, 48–54 (2005).
    1. Macchi, A., Borghesi, M. & Passoni, M. Ion acceleration by superintense laser-plasma interaction. Rev. Modern Phys.10.1103/RevModPhys.85.751 (2013).
    1. Daido, H., Nishiuchi, M. & Pirozhkov, A. S. Review of laser-driven ion sources and their applications. Rep. Prog. Phys.75, 056401 (2012). - PubMed
    1. Borghesi, M. et al. Electric field detection in laser-plasma interaction experiments via the proton imaging technique. Phys. Plasmas9, 2214–2220 (2002).

LinkOut - more resources