. 2025 Jan 24;11(1):23.
doi: 10.1038/s41531-024-00853-5.

Multiomics approach identifies dysregulated lipidomic and proteomic networks in Parkinson's disease patients mutated in TMEM175

Affiliations

Multiomics approach identifies dysregulated lipidomic and proteomic networks in Parkinson's disease patients mutated in TMEM175

Federica Carrillo et al. NPJ Parkinsons Dis. .

Abstract

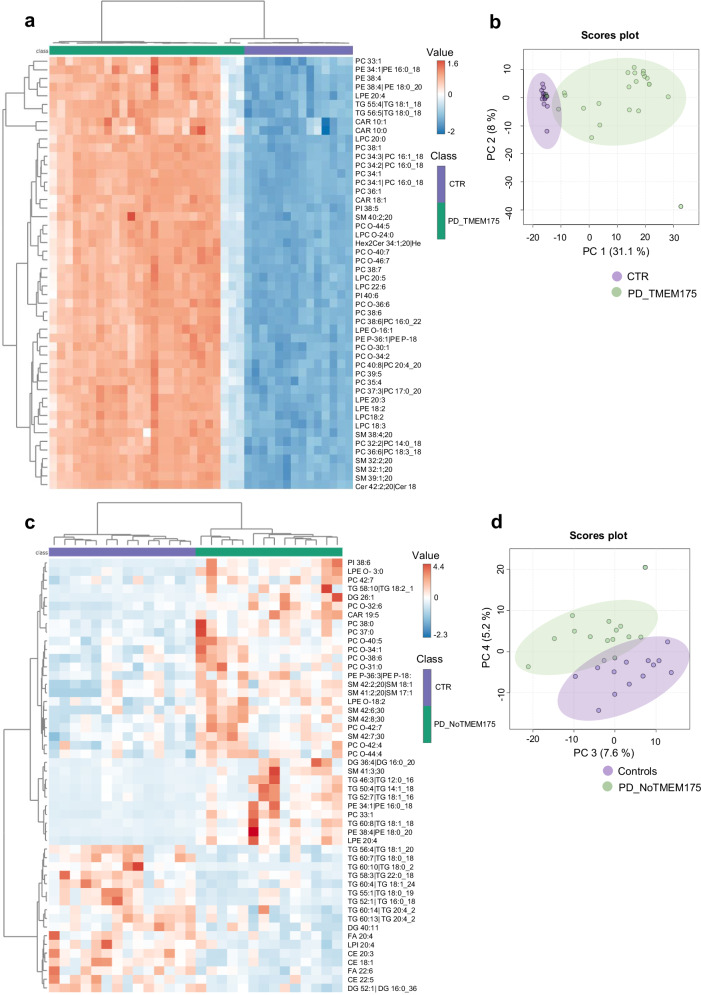
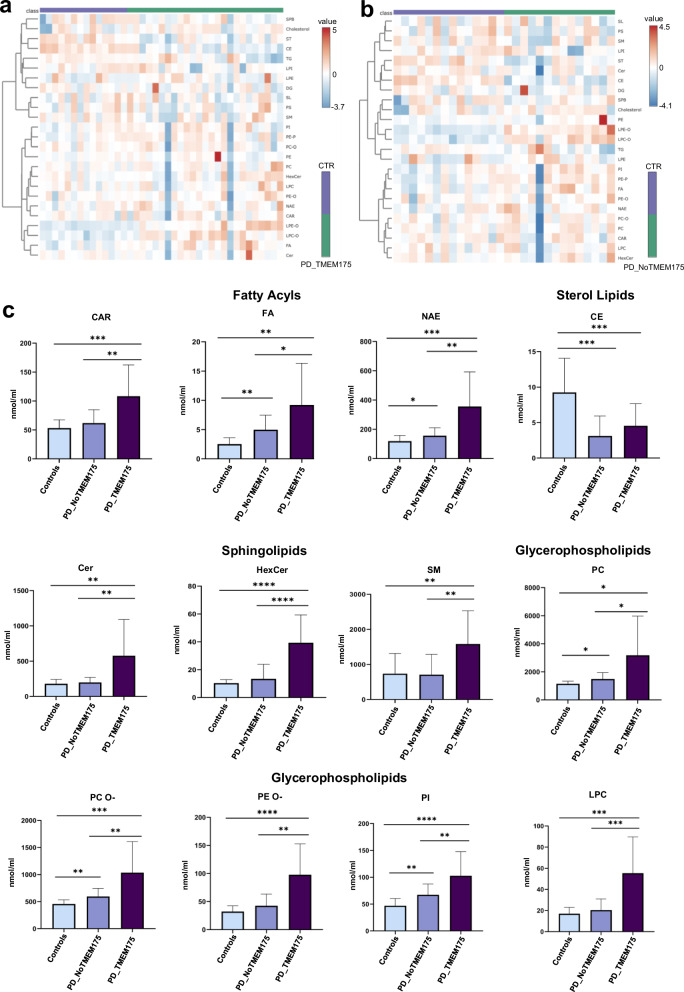
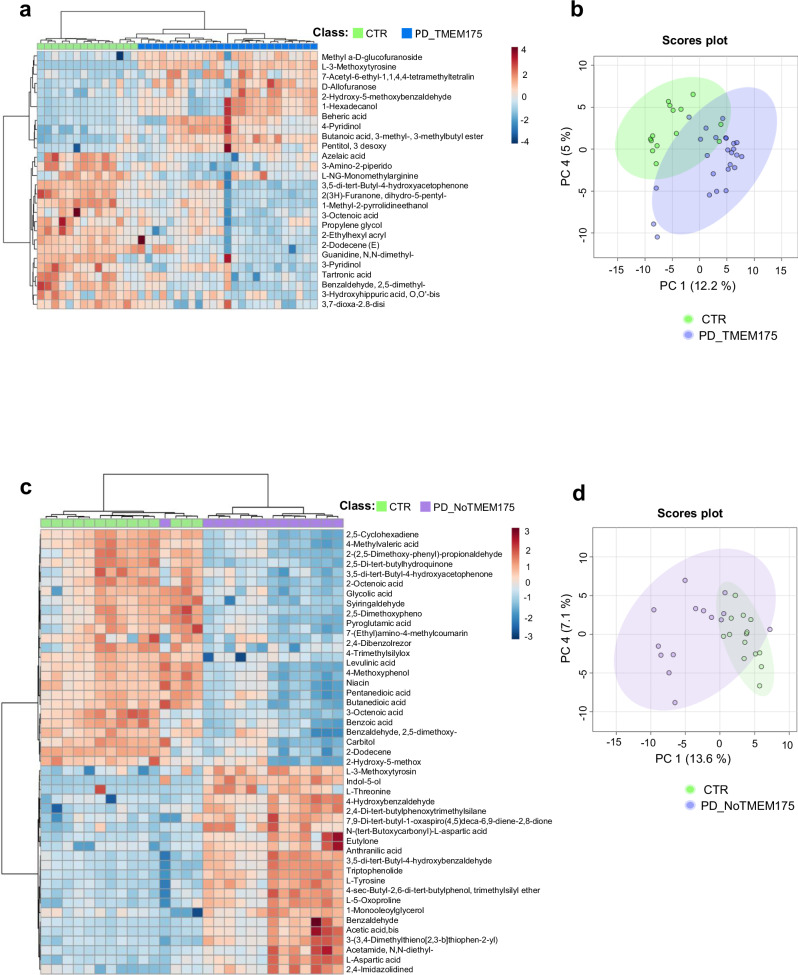
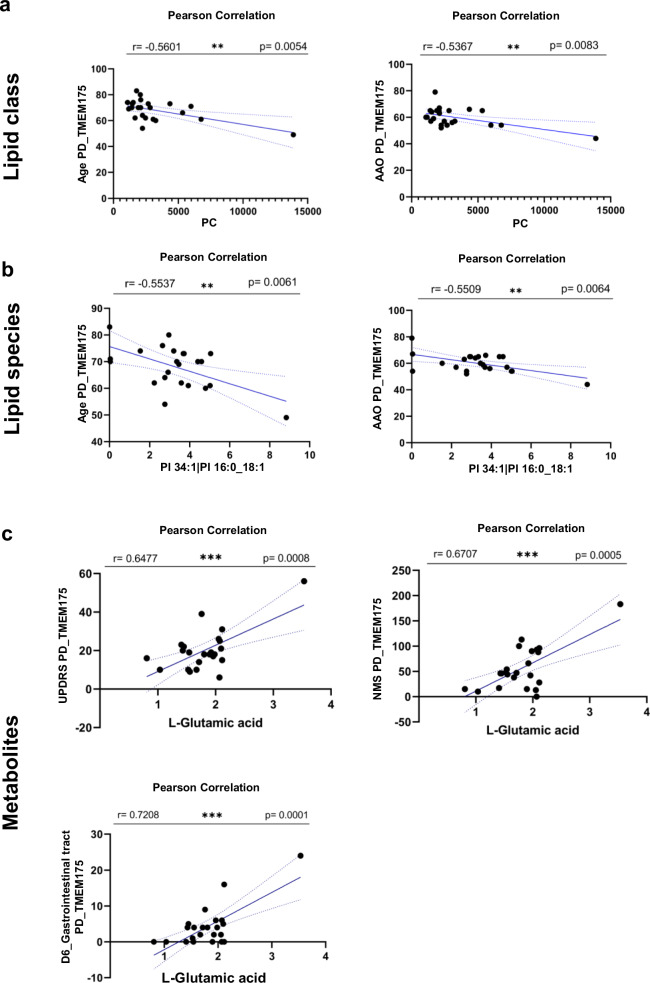
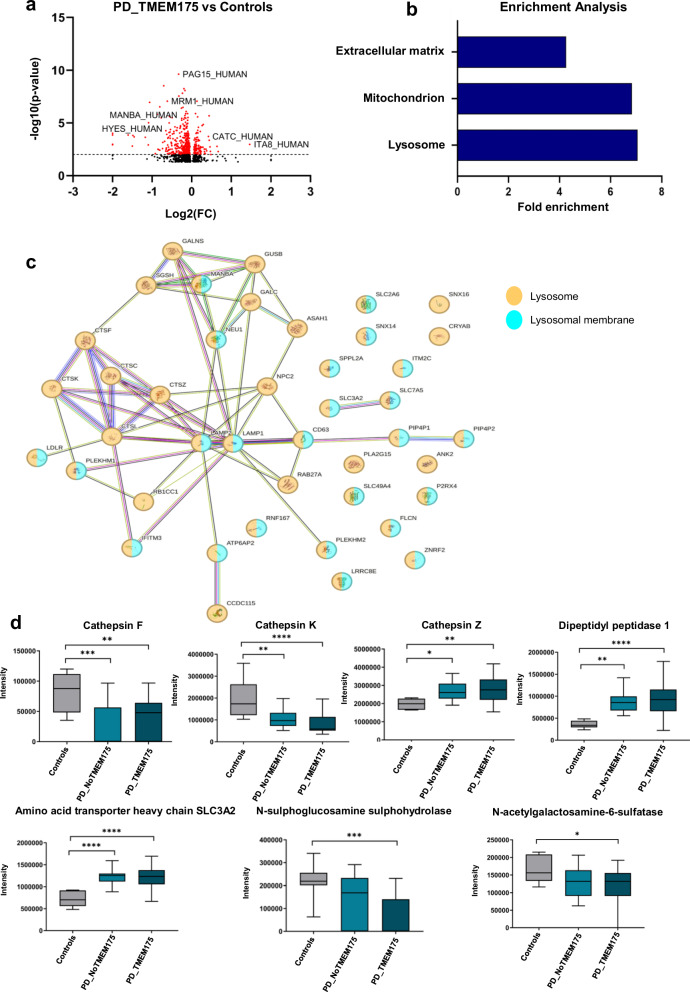
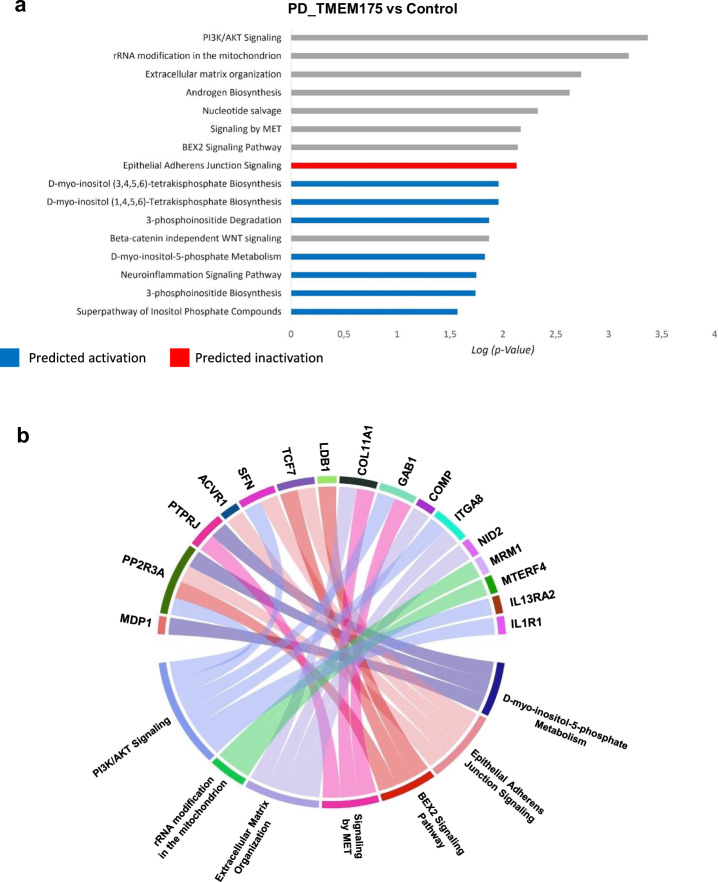
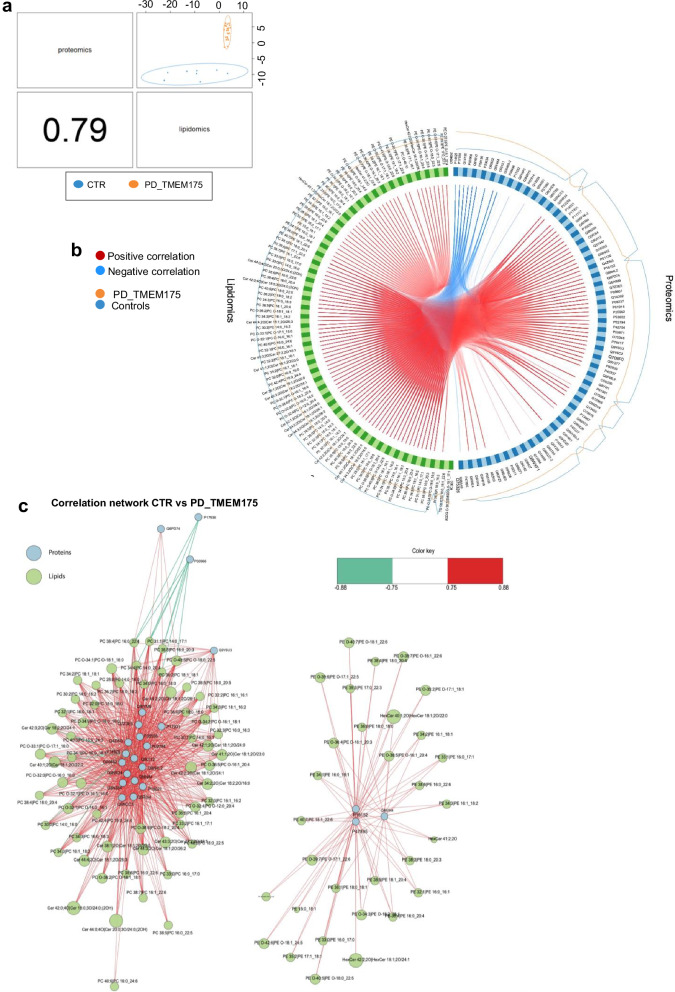
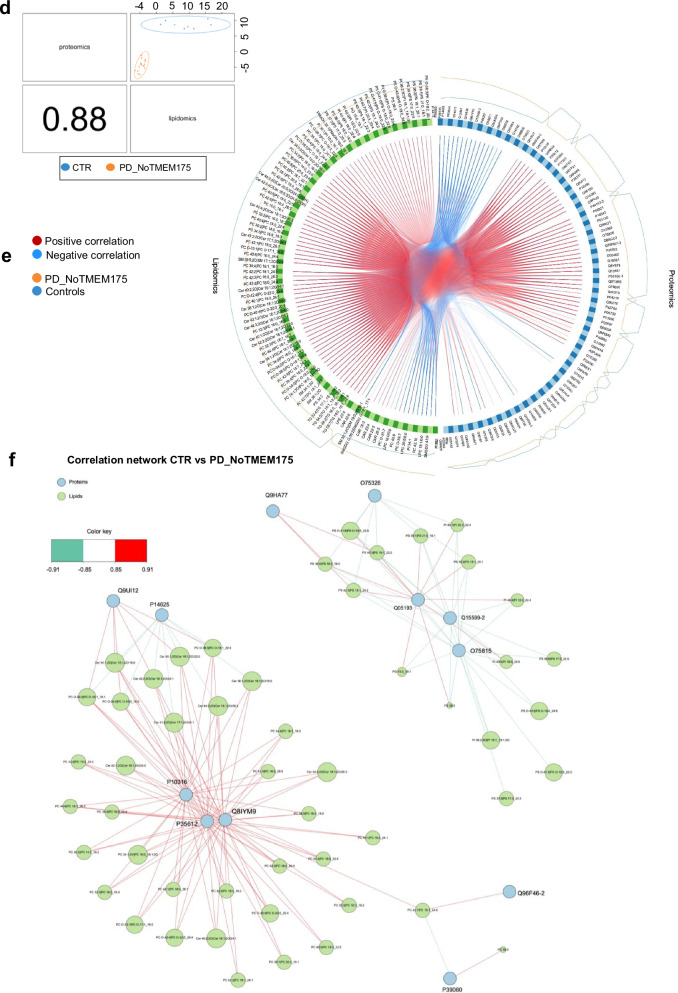
Parkinson's disease (PD) represents one of the most frequent neurodegenerative disorders for which clinically useful biomarkers remain to be identified and validated. Here, we adopted an untargeted omics approach to disclose lipidomic, metabolomic and proteomic alterations in plasma and in dermal fibroblasts of PD patients carrying mutations in TMEM175 gene. We revealed a wide dysregulation of lysosome, autophagy, and mitochondrial pathways in these patients, supporting a role of this channel in regulating these cellular processes. The most significant altered lipid classes were Fatty acyls, Glycerophospholipids and Phosphosphingolipids. The plasma level of Phosphatidylcholines (PC) and Phosphatidylinositol (PI) 34:1 significantly correlated with an earlier age at onset of the disease in TMEM175 patients (p = 0.008; p = 0.006). In plasma we also observed altered amino acids metabolic pathways in PD patients. We highlighted that increased level of L-glutamate strongly correlated (p < 0.001) with the severity of motor and non-motor symptoms in PD_TMEM175 patients. In dermal fibroblasts, we disclosed alterations of proteins involved in lipids biosynthesis (PAG15, PP4P1, GALC, FYV1, PIGO, PGPS1, PLPP1), in the insulin pathway (IGF2R), in mitochondrial metabolism (ACD10, ACD11, ACADS) and autophagy (RAB7L). Interestingly, we quantified 43 lysosomal or lysosomal-related proteins, which were differentially modulated between TMEM175 patients and controls. Integrative correlation analysis of proteome and lipidome of PD_TMEM175 cellular models identified a strong positive correlation of 13 proteins involved in biosynthetic processes with PC and Ceramides. Altogether, these data provide novel insights into the molecular and metabolic alterations underlying TMEM175 mutations and may be relevant for PD prediction, diagnosis and treatment.


Conflict of interest statement

Competing interests: The authors declare no competing interests.

Figures

Fig. 1
Fig. 1. Workflow.
Graphical representation of the study. The figure was created with BioRender.com (www.biorender.com).
Fig. 2
Fig. 2. Heatmap representation and unsupervised PCA of plasma lipids.
a, b Heatmap representation of the most 50 differentially expressed lipid species highlighting the clusters of the two groups of analysis when comparing PD_TMEM175 (a) and PD_NoTMEM175 (b) versus the Control subjects. c, d Unsupervised PCA displayed a well separation of the groups of analysis reflecting the percentage of contribution of PC1 and PC2 to the variance by comparing PD_TMEM175 (c) and PD_NoTMEM175 (d) to the control group.
Fig. 3
Fig. 3. Altered lipid distribution in plasma samples of PD_TMEM175 group.
a, b Volcano plot showed the distribution of the most significant altered lipid species comparing PD_TMEM175 vs Control (a) and PD_NoTMEM175 vs Control group (b). Lipids showing statistically significant different expression are in the top right (upregulated) and top left (downregulated) quadrants. The black line represents the p-value threshold set to p < 0.01. Lipid species significantly altered reflecting a wide upregulation of lipids in the group of PD_TMEM175 with respect to the PD-NoTMEM175 compared to the control ones. c, d Comparison of the circulating lipid expression of the PD_TMEM175 patients versus the control samples (c) and of the PD_NoTMEM175 patients versus the control samples (d). Data are shown as mean ± Standard Deviation (SD) of Log2 Fold Change (FC). Lipid species were considered with 0.65 ≤ FC ≥ 1.5. e, f The two contrasts PD_TMEM175 (e) and PD_NoTMEM175 (f) versus controls reflected an increased percentage of lipid species in the most of lipid class except for Cholesterol Esters (CE) in both groups of PD patients.
Fig. 4
Fig. 4. The plasma concentration of the most altered lipid classes in PD_TMEM175 group.
a, b Hierarchical heatmap showed clustering of lipid classes in both PD_TMEM175 (a) and PD_NoTMEM175 (b) with respect to the control group. c Comparison of plasma concentration of the most dysregulated lipid classes in PD_TMEM175 patients displayed a significant increase of Fatty Acyls (CAR, FA and NAE), Sphingolipids (Cer, HexCer and SM), Glycerophospholipids (PC, PC O-, PE O-, PI and LPC) with respect to both the control subjects and PD_NoTMEM175 patients. Data are represented as mean ± SD and were analysed with unpaired T-test. ****p-value < 0.0001, ***p-value < 0.001, **p-value < 0.01, *p-value < 0.05.
Fig. 5
Fig. 5. Analysis of metabolomic profile in plasma samples.
a, c Heatmap representation of the most significant representative metabolites displayed discrimination between the PD_TMEM175 (a) and PD_NoTMEM175 (c) groups with respect to the control one. b, d Principal component analysis (PCA) showed two defined groups of analysis indicating differences in metabolome profile by considering PD_TMEM175 (b) and PD_NoTMEM175 (d) compared to the controls.
Fig. 6
Fig. 6. Dysregulation of amino acid pathways in plasma of PD patients.
a, b Volcano plot showed the most significant altered metabolites by comparing both PD_TMEM175 (a) and PD_NoTMEM175 (b) vs the Control group. Red dots represented metabolites significantly altered reflecting a minor number of modulated molecules in the group of PD_TMEM175. The black line represents the p-value threshold set to p ≤ 0.01. cf Metabolome view of pathway impact analysis obtained from metabolites differentially expressed in PD_TMEM175 (c, e) and PD_NoTMEM175 (d, f) compared to the controls. Data showed an enrichment of pathways involved in amino acid metabolism in PD_TMEM175 group. The colour and size of each circle are based on p-values (yellow: higher p-values and red: lower p-values) and pathway impact values (the larger the circle the higher the impact score) calculated from the topological analysis, respectively. Pathways were considered significantly enriched if p ≤ 0.05, impact 0.1 and number of metabolite hits in the pathway >1.
Fig. 7
Fig. 7. Levels of lipids and metabolites in plasma of TMEM175 patients correlated with PD endophenotypes.
a, b Graphical representation of the significant negative correlation of the levels of PC and PI 34:1|PI 16:0_18:1 with age and age at onset (AAO) in PD_TMEM175 patients. c L-Glutamic acid showed a significant positive correlation with UPDRS, NMS and D6 Gastrointestinal trait score in PD_TMEM175 patients. Correlation was evaluated with Pearson analysis and p-value was corrected with Bonferroni multiple testing. r and p-value (p) were reported in the graph for each analysis.
Fig. 8
Fig. 8. Heatmap representation and unsupervised PCA of cellular lipids.
a, c Heatmap representation showed the presence of two groups of analysis and confirmed a wide dysregulation of lipid species at cellular level when comparing both PD_TMEM175 (a) and PD_NoTMEM175 groups (c) with respect to control one. b, d PCA showed a well separation of the two groups of PD patients compared to the controls.
Fig. 9
Fig. 9. Altered lipid distribution in human dermal fibroblasts.
a, b Volcano plot representation of altered expressed lipid species showed a wide downregulation of lipid species at cellular level in the group of PD_TMEM175. Lipid species were selected with p-value ≤ 0.01 and FC ≤0.65 and ≥1.5. c, d Hierarchical heatmap displayed clustering of lipid classes among PD_TMEM175 (c) and PD_NoTMEM175 (d) compared to the control group. e The most dysregulated lipid classes in PD_TMEM175 patients were CAR, HexCer and PI. Data are represented as mean ± SD and were analysed with unpaired T-test. ****p-value < 0.0001, ***p-value < 0.001, **p-value < 0.01, *p-value < 0.05.
Fig. 10
Fig. 10. PD_TMEM175 patients displayed alteration of lysosomal and mitochondrial proteins.
a Volcano plot showed the most significantly altered proteins comparing PD_TMEM175 vs Controls. Red dots represented proteins significantly altered reflecting a higher number of downregulated proteins in PD_TMEM175 compared to the controls. The black line represents the p-value threshold set to p ≤ 0.01. b Proteomic profile of PD_TMEM175 group compared to controls was evaluated by pathway enrichment analysis in terms of cellular components. The analysis, performed in the DAVID database, showed an enrichment of proteins localised into the extracellular matrix, lysosome and mitochondrion. Data were represented as fold enrichment value. c Protein-protein interaction analysis of the modulated lysosomal and lysosomal-related proteins in PD_TMEM175 patients was performed in STRING database. The result showed an interaction node of about 26 proteins found to be modulated in PD_TMEM175 patients. d Boxplots showed the abundance of the most modulated lysosomal and lysosomal-related proteins in the three groups of analysis. p-value was evaluated by ONE-way ANOVA, *p < 0.05, **p < 0.01, ***p < 0.001 and ****p < 0.0001.
Fig. 11
Fig. 11. PD_TMEM175 group displayed alteration of lysosomal and mitochondrial proteins.
a Complete list of canonical pathways associated with the dysregulated proteins identified in the respective dataset. Y-axis lists the canonical pathway, and the X-axis is the log of the corresponding p-value for each. Red colouring indicates the pathway is activated and blue colouring indicates the pathway is inhibited. No colouring indicates insufficient data in the dataset or the IPA knowledge base to determine if the pathway is activated or inhibited. b Graphical representation of cellular pathways and respective proteins resulted altered in PD_TMEM175-derived dermal fibroblasts compared to the controls.
Fig. 12
Fig. 12. Integrative correlation analysis of proteome and lipidome of PD_TMEM175 cellular models.
Comprehensive exploration with data integration analysis of proteomics and lipidomics data from cellular models. a, d Inter-omics correlations presented by sample scatterplots displaying the first components of each dataset (proteins and lipids) when comparing both PD_TMEM175 (a) and PD_NoTMEM175 groups (d) with respect to controls. Correlations were calculated using Pearson correlation between each dataset (lower diagonal plot). b, e Circos plot representing the averaged expression of proteins and lipids in each cell type (PD_TMEM175 and PD_NoTMEM175) and correlations between the features selected in each of the data blocks (protein features coloured in blue, and lipids features in green). c, f Relevant network plot showing positive (red lines) and negative (green lines) correlations between features from each dataset.

References

    1. Bloem, B. R., Okun, M. S. & Klein, C. Parkinson’s disease. Lancet397, 2284–2303 (2021). - PubMed
    1. Braak, H. et al. Staging of brain pathology related to sporadic Parkinson’s disease. Neurobiol. Aging24, 197–211 (2003). - PubMed
    1. Schapira, A. H. V., Chaudhuri, K. R. & Jenner, P. Erratum: Non-motor features of Parkinson disease. Nat. Rev. Neurosci.18, 509–509 (2017). - PubMed
    1. Espay, A. J. et al. Biomarker‐driven phenotyping in Parkinson’s disease: a translational missing link in disease‐modifying clinical trials. Mov. Disord.32, 319–324 (2017). - PMC - PubMed
    1. Galper, J. et al. Lipid pathway dysfunction is prevalent in patients with Parkinson’s disease. Brain145, 3472–3487 (2022). - PMC - PubMed

LinkOut - more resources