. 2025 Feb;57(2):413-426.
doi: 10.1038/s41588-024-02048-3. Epub 2025 Jan 24.

Human subcutaneous and visceral adipocyte atlases uncover classical and nonclassical adipocytes and depot-specific patterns

Affiliations

Human subcutaneous and visceral adipocyte atlases uncover classical and nonclassical adipocytes and depot-specific patterns

Or Lazarescu et al. Nat Genet. 2025 Feb.

Abstract

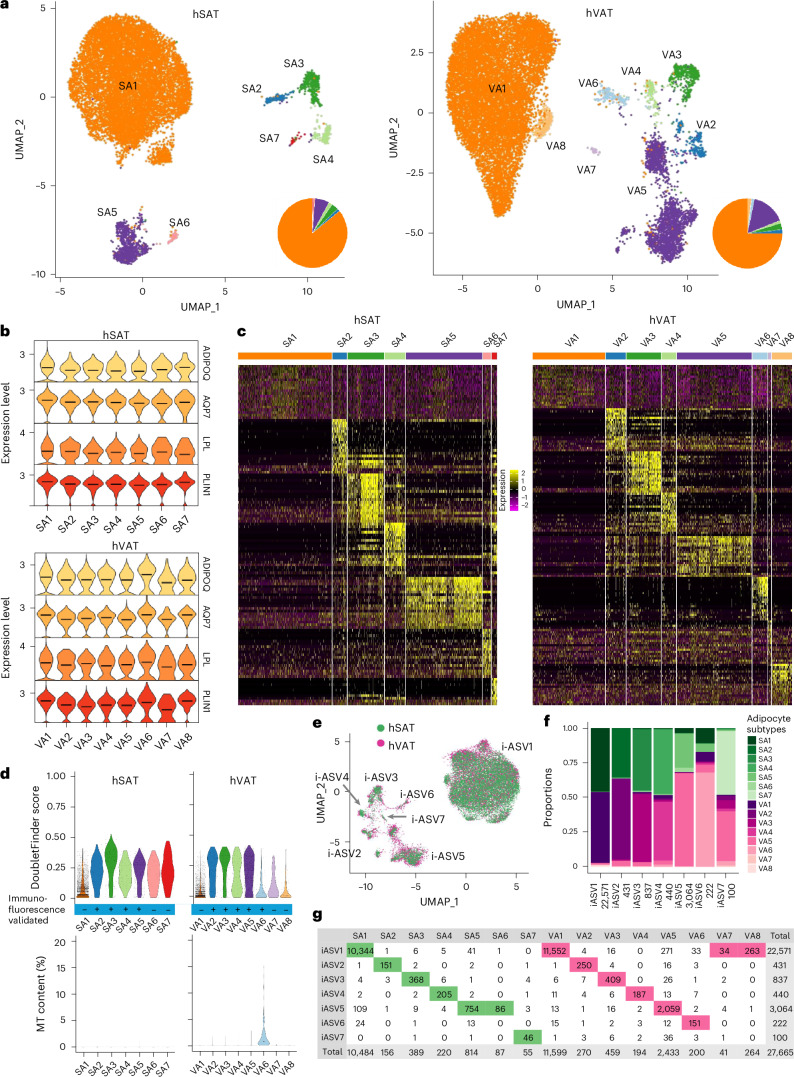
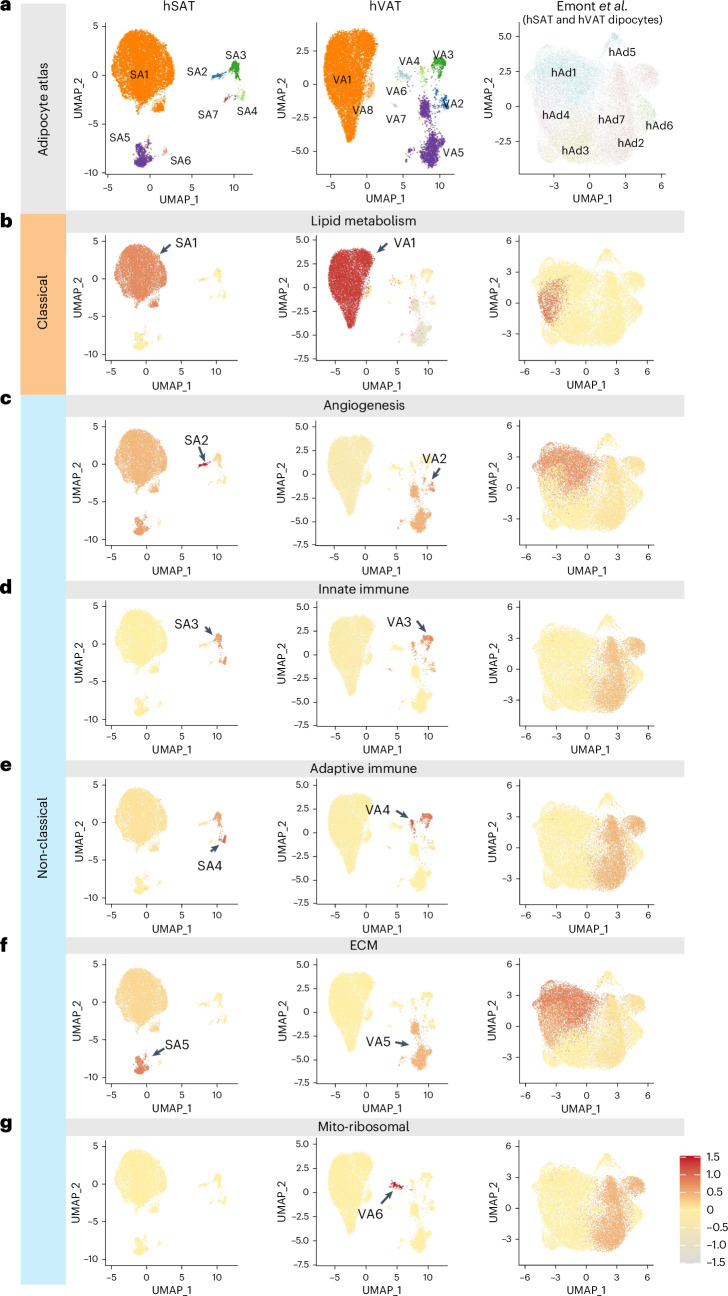
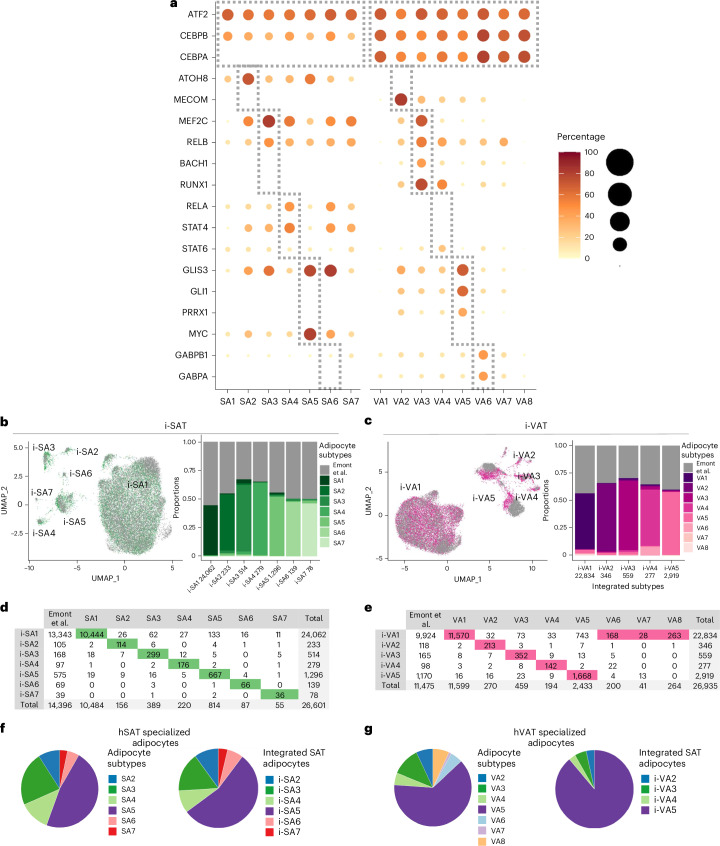
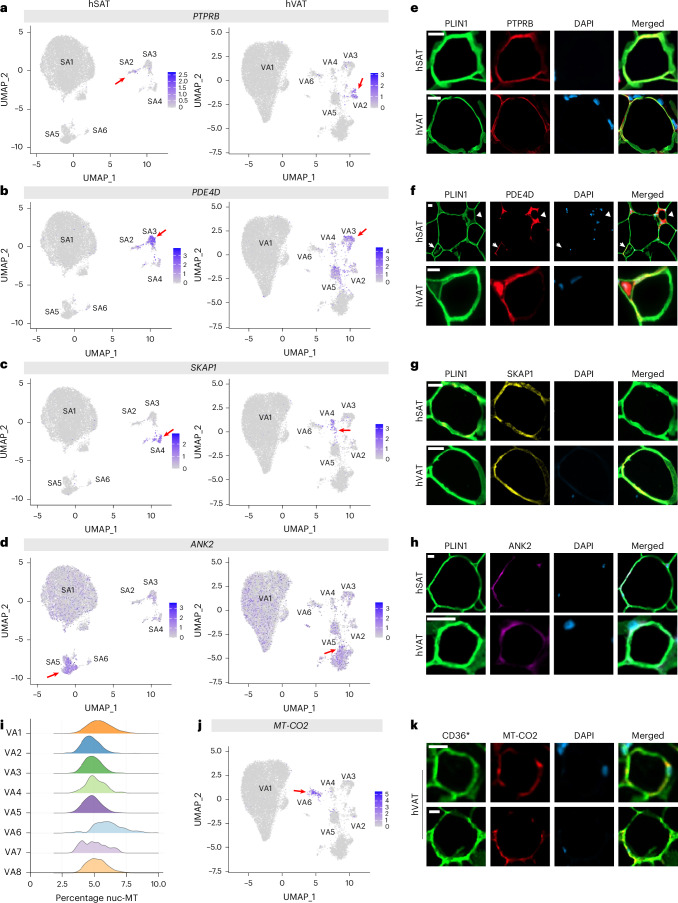
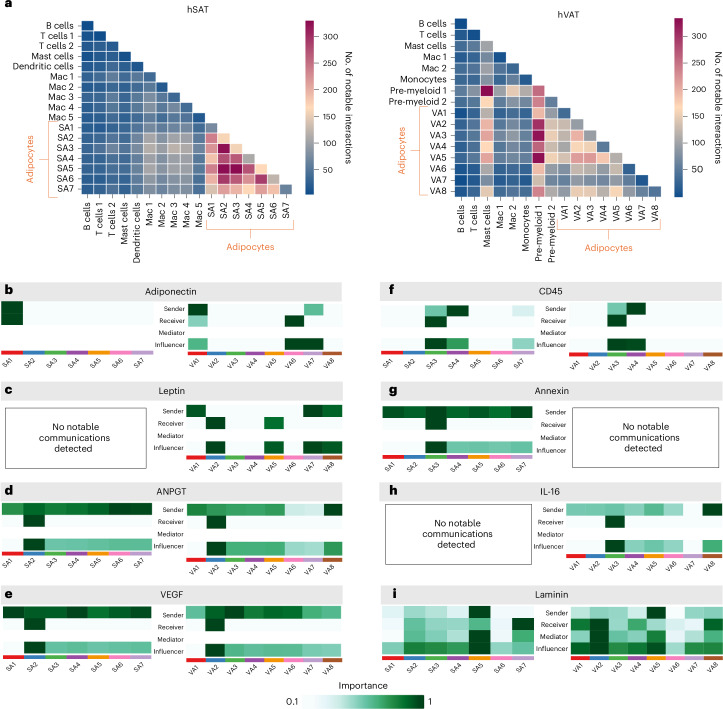
Human adipose depots are functionally distinct. Yet, recent single-nucleus RNA sequencing (snRNA-seq) analyses largely uncovered overlapping or similar cell-type landscapes. We hypothesized that adipocyte subtypes, differentiation trajectories and/or intercellular communication patterns could illuminate this depot similarity-difference gap. For this, we performed snRNA-seq of human subcutaneous or visceral adipose tissues (five or ten samples, respectively). Of 27,665 adipocyte nuclei in both depots, most were 'classical', namely enriched in lipid metabolism pathways. However, we also observed 'nonclassical' adipocyte subtypes, enriched in immune-related, extracellular matrix deposition (fibrosis), vascularization or angiogenesis or ribosomal and mitochondrial processes. Pseudo-temporal analysis showed a developmental trajectory from adipose progenitor cells to classical adipocytes via nonclassical adipocytes, suggesting that the classical state stems from loss, rather than gain, of specialized functions. Last, intercellular communication routes were consistent with the different inflammatory tone of the two depots. Jointly, these findings provide a high-resolution view into the contribution of cellular composition, differentiation and intercellular communication patterns to human fat depot differences.


Conflict of interest statement

Competing interests: M.B. received honoraria as a consultant and speaker from Amgen, AstraZeneca, Bayer, Boehringer-Ingelheim, Daiich-Sankyo, Lilly, Novo Nordisk, Novartis, Pfizer and Sanofi. All other authors declare no competing interests.

Figures

Fig. 1
Fig. 1. Single-nuclei atlases of hSAT and hVAT.
a, Clinical characteristics of the 15 samples used to build the atlases. Samples were collected from female and male donors with varying age and BMIs, as described in the pie charts. Characteristics were measured directly or extracted from donors’ medical records. b, The expression of the adipocyte marker adiponectin (ADIPOQ) in Uniform Manifold Approximation and Projection (UMAP) representations of hSAT and hVAT snRNA-seq atlases containing 37,879 and 83,731 nuclei, respectively. In both depots, adipocytes constitute a well-defined cluster. c, The expression of cell-specific markers in different clusters of each depot. Adipocytes were distinguished by multiple markers (marked in orange). d, The fraction of adipocytes per depot, stratified by sex, age and BMI in the snRNA-seq in-house data (hSAT, hVAT) and on estimating adipocyte proportions using deconvolution (Decon.) analysis of 73 paired bulk RNA-seq profiles (‘Decon’; hSAT:hVAT). Adipocytes were significantly more prevalent in hSAT versus hVAT in both datasets (two-sided Mann–Whitney U-test P = 0.0013 and P = 1.205 × 10−13, respectively), and tended to be more prevalent in females versus males according to the snRNA-seq data (two-sided Mann–Whitney U-test P = 0.044 in hVAT only). Other differences were not statistically significant. The boxplot central band indicates the median, the box limits the 25th to 75th percentiles and the whiskers 1.5× the interquartile range. Source data
Fig. 2
Fig. 2. Adipocyte-specific atlases of hSAT and hVAT.
a, UMAP representations of hSAT and hVAT adipocyte atlases containing 12,205 and 15,460 nuclei, respectively. Pie charts show the relative abundance of each adipocyte subset. b, The expression of adipocyte markers in adipocyte clusters of each depot. Distinct clusters expressed markers at similar levels. c, Heatmaps based on the top 20 markers of each adipocyte cluster in hSAT and hVAT. Adipocyte clusters are represented by all their nuclei (columns), except for SA1 and VA1 which are represented by a randomly selected subset of nuclei as a result of their large size. d, Violin plots depicting below-threshold DoubletFinder score (upper) and mitochondrial (MT) content (lower) per adipocyte cluster. Clusters that were validated by immunofluorescence (Fig. 5) were marked with ‘+’. e, UMAP representation of the integrated hSAT and hVAT adipocyte atlases, showing that most subsets overlap between the two depots. f, The proportions of SA1–7 and VA1–8 in each iASV1–7 cluster. The total number of nuclei per integrated cluster appears below the cluster name. g, The number of nuclei from SA1–7 and VA1–8 (columns) that contribute to each integrated cluster (rows). Per column, the entry corresponding to the maximal value (that is, most nuclei) is highlighted.
Fig. 3
Fig. 3. Characterization of adipocyte clusters of hSAT and hVAT.
a, UMAP representations of the in-house hSAT and hVAT adipocyte atlases and the combined hSAT and hVAT adipocyte atlas of Emont et al.. Each UMAP is colored by the adipocyte subtypes defined herein (for hSAT and hVAT) or by Emont et al. (right). bg, UMAP representations of hSAT, hVAT and Emont et al. adipocyte atlases: lipid metabolism (b); angiogenesis (c); innate immune (d); adaptive immune (e); ECM (f); and mito-ribosomal (g). Each cluster is colored by its mean normalized enrichment scores (NES) for GO annotations related to the process specified in the panel (see color legend at bottom right). Adipocyte subtypes were enriched for distinct processes, suggesting that they have different functionalities.
Fig. 4
Fig. 4. Further characterization of adipocyte clusters of hSAT and hVAT.
a, Potentially active regulons (rows) within adipocyte subtypes (columns). The regulons were named by their transcription factor; circle size and color intensity indicate the percentage of nuclei with a potentially active regulon. The gray boxes mark all adipocyte subtypes (top box) or specific subtypes. b,c, UMAP representations of the integration of our in-house adipocyte atlases (green, hSAT; pink, hVAT) and the atlases of Emont et al. (gray): i-SAT (b) and i-VAT (c). The proportions of SA1–7 and VA1–8 in each integrated SAT (i-SA1–7) or VAT (i-VA1–5) cluster are depicted in the bar plots. The total number of nuclei per integrated cluster appears below the cluster name. d,e. The number of nuclei (columns) from SA1–7 (d) or VA1–8 (e) and Emont et al. that contribute to each integrated cluster (rows). Per column, the entry corresponding to the maximal value (that is, most nuclei) is highlighted. f, The similar distribution of nuclei among nonclassical adipocyte clusters for the in-house dataset (SA2–7, left) and the Emont et al. atlas (i-SA2–7). g, Same as f, for hVAT (VA2–8, i-VA2–5).
Fig. 5
Fig. 5. Validating nonclassical adipocytes in hSAT and hVAT by immunofluorescence using specific markers.
ad, UMAP representations of hSAT (left) and hVAT (right) adipocyte subpopulations depicting the expression of specific markers used to identify each subpopulation of nonclassical adipocytes. The markers used were PTPRB (a), PDE4D (b), SKAP1 (c) and ANK2 (d), corresponding to the identification of SA2/VA2–SA5/VA5, respectively. The red arrow indicates the specific nonclassical adipocyte subpopulation represented by the marker. eh, Representative images from both hSAT and hVAT of adipocytes displaying positive signal for the corresponding marker, visualized using immunofluorescence staining for PLIN1 (green), DAPI (blue), PTPRB (e; red), PDE4D (f; red), SKAP1 (g; yellow) and ANK2 (h; magenta). Scale bar, 20 μm. In f, the arrow indicates the PDE4D-positive adipocyte and the arrowhead points to a crown-like structure (CLS). Representative images of adipocytes from six to eight different patients (from at least two independent staining experiments) are shown. ik, Validating VA6 in hVAT. i, Violin plots of nuc-MT gene expression in the hVAT adipocyte clusters VA1–8. VA6 had significantly higher expression of nuc-MT genes relative to other hVAT adipocytes (two-sided Mann–Whitney U-test P < 2.2 × 10−16). j, Expression of MT-CO2 in hVAT adipocyte-clustering UMAP (arrow pointing to the relatively highly expressing VA6). k, Immunofluorescence staining for CD36 (green), MT-CO2 (red) and DAPI (blue). *Adipocytes identified with CD36 rather than PLIN1 to enable co-staining with MT-CO2. Scale bar, 20 μm. Representative images of adipocytes from five different patients (two independent staining experiments) are shown.
Fig. 6
Fig. 6. Estimated differentiation paths from ASPCs to adipocytes in hSAT and hVAT.
a, The expression of the ASPC marker PDGFRA in UMAP representations of hSAT snRNA-seq atlases. ASPCs constitute a well-defined cluster. b, The proportion of ASPC subclusters within the hSAT ASPCs. c, The expression of ASPC markers and of stem, fibrosis and adipogenic markers in hSAT ASPC subclusters. d, ASPCs, classical and nonclassical adipocytes in hSAT colored by cell group (left) with inset showing ASPCs colored by subcluster. Right, nuclei colored by their differentiation pseudotime from ASPCs (ASPC1). Nonclassical adipocytes were an intermediate state between ASPCs and classical adipocytes. Visualization was performed using ForceAtlas2 (FA) representation. e,f, Same as a (e) and b (f) for hVAT. g, The expression of ASPC markers and stem, fibrosis, adipogenic and mesothelial markers in hVAT ASPC subclusters. h, Same as d for hVAT. Nonclassical adipocytes appear as an intermediate state between ASPCs and classical adipocytes. ASPC4 shows a pseudotime comparable to nonclassical adipocytes, suggesting that it might lead to a different end-state.
Fig. 7
Fig. 7. Adipocytes and immune cells in hSAT and hVAT intercellular and signaling communication patterns.
a, The total number of interactions between cell types in hSAT and hVAT. The number of interactions among adipocyte subtypes is higher in hSAT. The number of interactions between adipocytes and the macrophage or myeloid compartment or mast cells is higher in hVAT compared with hSAT. The heatmap was calculated using CellPhoneDB. bi, The senders and receivers of specific signaling pathways among adipocytes in hSAT and hVAT. Analysis was performed using CellChat. b, classical adipocytes as the main senders of adiponectin in both depots. c, Leptin pathway missing from hSAT. In hVAT, classical adipocytes VA1 and VA7,VA8 are the main senders and VA2 and VA5 the main receivers. d,e, In both depots, angiogenic adipocytes SA2,VA2 are the main receivers of the angiogenesis-related ANGPT (d) and VEGF (e) signaling pathways. f, In both depots, immune-related adipocytes SA4,VA4 and SA3,VA3 are the main senders and receivers, respectively, of the immune CD45 signaling pathway. g, In hSAT alone, the anti-inflammatory signaling pathway Annexin is received mainly by SA3. h, In hVAT alone, the proinflammatory signaling pathway IL-16 received mainly by VA3. i, In both depots, the ECM adipocytes SA5,VA5 are the main senders of the ECM-related laminin signaling pathways.
Extended Data Fig. 1
Extended Data Fig. 1. UMAPs of the different markers used to identify adipocyte subpopulations in adipose tissue.
A-B. UMAPs of hSAT (A) and hVAT (B), colored by cell type. C-D. UMAPs of hSAT (C) and hVAT (D), colored by the expression of different markers used for the identification of the adipocyte subpopulations. Red arrows indicate, when apparent, zones in the adipocyte cluster expressing the specified gene. (The expression of these markers in UMAPs of adipocyte clusters is presented in Fig. 5).
Extended Data Fig. 2
Extended Data Fig. 2. Ensuring specificity of fluorescent signal in immunofluorescence analyses of non-classical adipocytes.
A-E. Representative images showing tissues expressing the specific marker used as a positive control (PTPRB – stomach (A); PDE4D – lymph node (B); SKAP1 – lymph node (C); ANK2 – kidney (D); MT-CO2 - colon (C)), no-primary antibody as a negative control, and the positive signal from within stained adipose tissue. The fluorescence emission spectra obtained from these slides are displayed in the graphs. White squares indicate the areas where spectrum measurements were taken. Shown are results of a single experiment per antibody. F. Images highlighting the presence of crown-like structures (CLS) within adipose tissue, visualized using immunofluorescence staining for PLIN1 (green), PDE4D (red) and DAPI (blue). CLS in adipose tissue act as an intrinsic positive control for PDE4D staining, displaying weak signal for PLIN1, accompanied by robust DAPI staining.
Extended Data Fig. 3
Extended Data Fig. 3. Examples of non-classical adipocytes from additional patients.
A-C. Representative images of adipocytes displaying positive signal for the different markers used to identify the different adipocytes subpopulations (PDE4D (A); SKAP1 (B); ANK2 (C)) taken from additional patients, with an additional zoomed out images to illustrate prevalence and localization. Thin scale bar = 20 μm. Thick scale bar = 200 μm. D. Similar analyses for validating VA6 using the protein marker encoded by the mitochondrial gene MT-CO2, with CD36, instead of PLIN1, for staining adipocytes (*), for technical (antibody compatibility) purposes. Shown are representative images of adipocytes from 6-8 different patients (from at least 2 independent staining experiments).
Extended Data Fig. 4
Extended Data Fig. 4. Depot-specific correlations between estimated percentages of classical or non-classical adipocytes and clinical parameters.
Percentages of classical and non-classical adipocytes in each depot separately were estimated in an independent set of samples analyzed by bulk RNA-seq (n = 73), using sNucConv deconvolution algorithm (a validated deconvolution tool for human adipose tissue based on paired samples sequenced by both bulk and snRNA-seq – see Methods for more detail). The percentage of classical adipocytes in hSAT was negatively correlated with waist-to-hip ratio (WHR) and HOMA-IR (Spearman r = -0.4 and -0.55, adjusted p = 0.17 and 0.06, respectively). The percentage of non-classical adipocytes in hSAT was positively correlated with WHR and HOMA-IR (Spearman r = 0.34 and 0.6, adjusted p = 0.17 and 0.05, respectively). The percentage of classical adipocytes in hVAT was negatively correlated with decease in triglycerides (TG) post bariatric surgery (BS) (Spearman r = 0.49, adjusted p = 0.1). Shaded grey areas mark a confidence interval of 0.95. P-values were adjusted using Benjamini-Hochberg procedure. Source data
Extended Data Fig. 5
Extended Data Fig. 5. CD45 (PTPRC) identification as a marker for SA/VA 3 + 4 positive adipocytes in human adipose tissue using different approaches.
A. Representative IHC images of hSAT and hVAT sections stained with anti-CD45 Ab, with and without counterstaining to highlight the positive signal from the adipocytes. scale bar = 20 μm. Shown are representative images of adipocytes from 6-8 different patients (from at least 2 independent staining experiments). B. panel of representative images showing lymph node section expressing the specific marker used as a positive control, no-primary antibody as a negative control, and the positive signal from within stained adipose tissue. The fluorescence emission spectra obtained from these slides are displayed in the graph. White squares indicate the areas where spectrum measurements were taken. Shown are results of a single experiment. C-D. Representative images of adipocytes displaying positive signal for CD45 taken from hSAT and hVAT of two different patients (each panel shows a different patient). scale bar = 20 μm. These 2 patients are representative images of adipocytes from 6-8 different patients (from at least 2 independent staining experiments). E. Image-stream flow cytometry analyses of isolated human adipose tissue cells. PTPRC protein (CD45, common leukocyte antigen) is shown in SVF cells, potentially macrophages, and CD45-negative adipocytes (based on round morphology, diffuse Bodipy neutral lipids staining, CD36-postive, nuclear Draq5-negative, and with typically polarized light scattering). Shown are results of 1 of 2 independent experiments.
Extended Data Fig. 6
Extended Data Fig. 6. Expression of adiponectin, leptin, and their receptors in hSAT and hVAT.
A. Expression levels in adipocyte subtypes of hSAT (left) and hVAT (right). B. Expression levels in non-adipocyte cell-types of each depot.
Extended Data Fig. 7
Extended Data Fig. 7. Mast cells involvement as source for ECM, fibrotic and inflammatory pathways differs between depots.
A. In hVAT but not in hSAT, mast cells are senders of ECM and fibrotic pathways SEMA3, COLLAGEN and LAMININ. B. In hVAT but not in hSAT, mast cell are senders of the pro-inflammatory (IL16) signaling pathway.

References

    1. Dressler, W. W. Lifestyle, stress, and blood pressure in a southern black community. Psychosom. Med.52, 182–198 (1990). - PubMed
    1. Golan, R. et al. Abdominal superficial subcutaneous fat: a putative distinct protective fat subdepot in type 2 diabetes. Diabetes Care35, 640–647 (2012). - PMC - PubMed
    1. Ghaben, A. L. & Scherer, P. E. Adipogenesis and metabolic health. Nat. Rev. Mol. Cell Biol.20, 242–258 (2019). - PubMed
    1. Lee, M. J., Wu, Y. & Fried, S. K. Adipose tissue heterogeneity: implication of depot differences in adipose tissue for obesity complications. Mol. Asp. Med.34, 1–11 (2013). - PMC - PubMed
    1. Fain, J. N., Madan, A. K., Hiler, M. L., Cheema, P. & Bahouth, S. W. Comparison of the release of adipokines by adipose tissue, adipose tissue matrix, and adipocytes from visceral and subcutaneous abdominal adipose tissues of obese humans. Endocrinology145, 2273–2282 (2004). - PubMed

LinkOut - more resources