. 2025 Jun;32(6):979-994.
doi: 10.1038/s41594-025-01483-y. Epub 2025 Jan 24.

A network of interacting ciliary tip proteins with opposing activities imparts slow and processive microtubule growth

Affiliations

A network of interacting ciliary tip proteins with opposing activities imparts slow and processive microtubule growth

Harriet A J Saunders et al. Nat Struct Mol Biol. 2025 Jun.

Abstract

Cilia are motile or sensory organelles present on many eukaryotic cells. Their formation and function rely on axonemal microtubules, which exhibit very slow dynamics, but the underlying mechanisms are largely unexplored. Here we reconstituted in vitro the individual and collective activities of the ciliary tip module proteins CEP104, CSPP1, TOGARAM1, ARMC9 and CCDC66, which interact with each other and with microtubules and, when mutated in humans, cause ciliopathies such as Joubert syndrome. We show that CEP104, a protein with a tubulin-binding TOG domain, and its luminal partner CSPP1 inhibit microtubule growth and shortening. Another TOG-domain protein, TOGARAM1, overcomes growth inhibition imposed by CEP104 and CSPP1. CCDC66 and ARMC9 do not affect microtubule dynamics but act as scaffolds for their partners. Cryo-electron tomography demonstrated that, together, ciliary tip module members form plus-end-specific cork-like structures that reduce protofilament flaring. The combined effect of these proteins is very slow processive microtubule elongation, which recapitulates axonemal dynamics in cells.


Conflict of interest statement

Competing interests: The authors declare no competing interests.

Figures
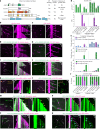
Fig. 1
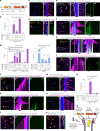
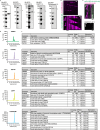
Fig. 1. CTM proteins have distinct effects on MT dynamics in vitro.
a, Schematic representation of CTM members and summary table highlighting individual protein effects on MT dynamics. MTB, MT-binding domain; PD, pause domain. b,c, Fields of view (left; scale bar: 2 µm) and kymographs (right; scale bars: 2 µm and 60 s) illustrating MT dynamics from GMPCPP-stabilized seeds with either 15 µM tubulin supplemented with 3% HiLyte-488-labeled tubulin or 20 nM GFP–EB3. df, Parameters of MT plus-end dynamics in the presence of 15 µM tubulin alone or with 20 nM EB3 in combination with indicated concentrations of proteins (from kymographs shown in b,c,ip and Extended Data Fig. 1d). d, Bars represent pooled data from three independent experiments (growth rate) or averaged means from three independent experiments (pause and block duration); total number of growth events, pauses/blocks: tubulin alone, n = 356, 0; 10 nM CCDC66, n = 411, 0; 10 nM CEP104, n = 306, 0; 100 nM CEP104, n = 0, 138; 10 nM CSPP1, n = 422, 97; 10 nM TOGARAM1, n = 347, 0; EB3 alone, n = 938, 0; EB3 with 10 nM CCDC66, n = 562, 0; EB3 with 10 nM CEP104, n = 213, 101; EB3 with CSPP1, n = 1715, 273; EB3 with TOGARAM1, n = 861, 0. ****P < 0.0001; NS, not significant (Kruskal–Wallis test followed by Dunn’s post hoc test; all conditions compared to their relevant control (either tubulin alone or tubulin with 20 nM EB3)). Videos were acquired for 10 min; therefore, this is the maximum time for pause duration. In e,f, bars represent averaged means from three independent experiments. Error bars represent the s.e.m. gp, Fields of view (left; scale bar: 2 µm) and kymographs (right; scale bars: 2 µm and 60 s) illustrating MT dynamics from GMPCPP-stabilized seeds either with 15 µM tubulin supplemented with 3% HiLyte-488-labeled or rhodamine-labeled tubulin or with 20 nM GFP–EB3 or mCherry–EB3 and indicated concentrations and colors of CTM proteins. Orange arrowheads, blocked plus ends; orange arrows, CEP104-tracking minus ends; yellow arrowheads, pauses; blue arrowheads, rescues. Source data
Fig. 2
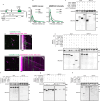
Fig. 2. A few CEP104 molecules stably block MT plus ends.
a, Fields of view (top) and histogram plot (bottom) of fluorescence intensities of single GFP molecules, GFP–EB3 dimers and GFP–CEP104 dimers immobilized in separate chambers of the same coverslip. Number of molecules analyzed: GFP, n = 29,981; GFP–EB3, n = 55,378; GFP–CEP104, n = 32,335. Scale bar: 2 µm. b, Representative MT with CEP104-blocked plus end (top) and histogram plot (bottom) of fluorescence intensities of single GFP molecules and GFP–CEP104 intensity at blocked plus end immobilized in separate chambers of the same coverslip. Number of molecules analyzed: GFP, n = 13,925; GFP–CEP104, n = 92. Scale bar: 2 µm. ce, FRAP analysis of CEP104 (c) and EB3 (d) at blocked MT plus ends or dynamic EB3 at growing plus ends (e). The arrowhead marks the point of photobleaching in representative kymographs. Scale bars: 2 µm and 60 s (c); 2 µm and 10 s (d,e). Plots show averaged curves with exponential fit. Number of FRAP measurements: CEP104, n = 17; stationary EB3, n = 14; dynamic EB3, n = 10. Error bars represent the s.e.m. Source data
Fig. 3
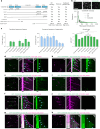
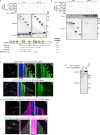
Fig. 3. Plus-end blocking by CEP104 is potentiated by EB3, CCDC66 and CSPP1.
a, Scheme of CEP104 constructs. b, Percentage of time MT plus ends spent blocked, from kymographs shown in ce and Fig. 1c,l. Bars represent averaged means from three independent experiments. Error bars represent the s.e.m. cf, Fields of view (left; scale bar: 2 µm) and kymographs (right; scale bars: 2 µm and 60 s) illustrating MT dynamics in indicated conditions. Orange arrowheads, blocked plus ends; white arrowheads, CEP104ΔTOG at seeds plus end; white arrows, CEP104-tracking minus ends. g, Parameters of MT plus-end dynamics, from kymographs shown in f,hl, and Extended Data Fig. 2b. For dynamic state, bars represent the averaged means from three independent experiments. For depolymerization rate, bars represent the pooled data from three independent experiments: 2 nM CEP104, n = 133; 2 nM CEP104 with 15 nM CCDC66, n = 23; 10 nM CEP104 with 15 nM CCDC66, n = 122; 2 nM CEP104 with 10 nM CSPP1, n = 69; 10 nM CEP104 with 10 nM CSPP1, n = 99; EB3 with 2 nM CEP104, n = 1; EB3 with 2 nM CEP104 and 15 nM CCDC66, n = 63; EB3 with 2 nM CEP104 and 10 nM CSPP1, n = 116. hn, Fields of view (left; scale bar: 2 µm) and kymographs (right; scale bars: 2 µm and 60 s) illustrating MT dynamics in indicated conditions. Light-orange arrowheads, blocked seeds; dark-orange arrowhead, blocked lattice; blue arrowheads, slow plus-end depolymerization. o, Fields of view (left; scale bar: 2 µm) and kymographs (right; scale bars: 2 µm and 60 s) illustrating MT dynamics in indicated conditions. Orange arrowheads, blocked plus ends. p, Percentage of time MT plus ends spent blocked, from kymographs shown in mo and Extended Data Fig. 2b. Bars represent the averaged means from three independent experiments. q, Scheme showing CEP104 domain functions and interactions with other CTM proteins. In b,g,p, error bars represent the s.e.m. ****P < 0.0001 (Kruskal–Wallis test followed by Dunn’s post hoc test). Source data
Fig. 4
Fig. 4. The rescue activity of TOGARAM1 depends on the TOG3 and TOG4 domains.
a, Schematic representation of different TOGARAM1 constructs and summary table highlighting their effects on MT dynamics. Vertical lines indicate point substitutions predicted to ablate tubulin-binding activity. b, Fields of view (top) and histogram plot (bottom) of fluorescence intensities of single GFP molecules, EB3 dimers and TOGARAM1 molecules immobilized in separate chambers of the same coverslip. Number of molecules analyzed: GFP, n = 57,865; EB3, n = 73,074; TOGARAM1, n = 74,306. Scale bar: 2 µm. c, Parameters of MT plus-end dynamics in the presence of 20 nM EB3 in combination with indicated concentrations of TOGARAM1 constructs (from kymographs shown in dh,k and Fig. 1c,p). For growth rates, bars represent the pooled data from three independent experiments. Total number of growth events: EB3 alone, n = 938; EB3 with TOGARAM1, n = 861; EB3 with TOMOGRAM1 1′2′34, n = 350; EB3 with TOMOGRAM1 123′4′, n = 337; EB3 with TOMOGRAM1 123′4, n = 560; EB3 with TOMOGRAM1 1234′, n = 253; EB3 with L-TOG-34, n = 131; EB3 with 200 nM TOG3–TOG4, n = 150. For transition frequencies, bars represent the averaged means from three independent experiments. Error bars represent the s.e.m., ****P < 0.0001 (Kruskal–Wallis test followed by Dunn’s post hoc test). dk, Fields of view (left; scale bar: 2 µm) and kymographs (right; scale bars: 2 µm and 60 s) illustrating MT dynamics from GMPCPP-stabilized seeds with 20 nM GFP–EB3 or mCherry–EB3 and indicated concentrations and colors of TOGARAM1 constructs. Assays were repeated three independent times. Blue arrowheads, rescues. Source data
Fig. 5
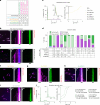
Fig. 5. ARMC9 colocalizes with TOGARAM1 and CSPP1 and enhances their effects on MT dynamics.
ac, Fields of view (left; scale bar: 2 µm) and kymographs (right; scale bars: 2 µm and 60 s) illustrating MT dynamics from GMPCPP-stabilized seeds with 20 nM GFP–EB3 or mCherry–EB3 in indicated conditions. Assays were repeated independently three times. Blue arrowheads, ARMC9 and TOGARAM1 colocalization. d, Parameters of MT plus-end dynamics in the presence of 20 nM EB3 in combination with indicated concentrations of TOGARAM1 constructs and ARMC9 (from kymographs shown in a,b and Figs. 1c,p and 4e). For growth rates, bars represent the pooled data from three independent experiments. Total number of growth events: EB3 alone, n = 938; EB3 with TOGARAM1, n = 861; EB3 with TOGARAM1 and ARMC9, n = 342; EB3 with TOGARAM1 123′4′, n = 337; EB3 with TOGARAM1 123′4′ and ARMC9, n = 325. For transition frequencies, bars represent averaged means from three independent experiments. Error bars represent the s.e.m. ****P < 0.0001 (Kruskal–Wallis test followed by Dunn’s post hoc test). e, Fields of view (left; scale bar: 2 µm) and kymographs (right; scale bars: 2 µm and 60 s) illustrating MT dynamics from GMPCPP-stabilized seeds with 20 nM GFP–EB3 and CTM proteins indicated. Yellow arrowheads, colocalization. f, Parameters of MT plus-end dynamics with 20 nM EB3 in combination with indicated concentrations of ciliary top module proteins (from kymographs shown in e and Fig. 1c,n). For growth rate and pause duration, bars represent the pooled data from three independent experiments. Total number of growth events, pauses: EB3 alone, n = 938, 0; EB3 with CSPP1, n = 1,715, 273; EB3 with CSPP1 and ARMC9, n = 627, 315. For transition frequencies and dynamic state, bars represent the averaged means from three independent experiments. Error bars represent the s.e.m. ****P < 0.0001 (Kruskal–Wallis test followed by Dunn’s post hoc test). g,h, Fields of view (left; scale bar: 2 µm) and kymographs (right; scale bars: 2 µm and 60 s) illustrating MT dynamics from GMPCPP-stabilized seeds with 20 nM GFP–EB3 in indicated conditions. Assays were repeated independently three times. Yellow arrowheads, colocalization. i, Schematic model showing TOGARAM1, ARMC9 and CSPP1 interaction domains. Source data
Fig. 6
Fig. 6. CEP104 and TOGARAM1 are sufficient to impart slow MT growth.
a, Field of view (left; scale bar: 2 µm) and kymograph (right; scale bars: 2 µm and 60 s) illustrating MT dynamics with GFP–EB3, mCherry–TOGARAM1 and GFP–CEP104. be, Parameters of MT plus-end dynamics in the presence of EB3 in combination with indicated concentrations of CTM proteins (from kymographs shown in a and Fig. 1c,l,p). For pause and block duration (b) and growth rates (d), data were pooled from three independent experiments. Total number of growth events, pauses: EB3 alone, n = 938, 0; EB3 with CEP104, n = 213, 101; EB3 with TOGARAM1, n = 861, 0; EB3 with CEP104 and TOGARAM1, n = 373, 140. Bars represent the mean ± s.e.m. For dynamic state (c) and transition frequencies (e), bars represent the averaged means from three independent experiments. Error bars represent the s.e.m. f, Scheme showing interactions between CEP104, TOGARAM1 and tubulin. Source data
Fig. 7
Fig. 7. Combined action of CTM proteins drives slow processive MT growth.
a,b, Reconstitutions of indicated concentrations and colors of CTM proteins (a). Fields of view (left; scale bar: 2 µm) and kymograph (middle; combined colors; right, CEP104 only; scale bars: 2 µm and 60 s) (b) illustrating MT dynamics from GMPCPP-stabilized seeds with 20 nM GFP–EB3 (in magenta) and CTM components indicated in a. c,d, Weighted growth rates (c) and dynamic state (d) for combinations of CTM proteins indicated (from kymographs in b,ei, Fig. 1c and Extended Data Fig. 6e–k). Growth rates in c are represented as histograms (left; with the inset showing enlargement for the rate values under 1 µm min−1) and cumulative frequency diagrams (right). Data were pooled from three independent experiments. Total number of growth events: EB3 alone, n = 938; entire CTM, n = 70; no ARMC9, n = 81; no CCDC66, n = 83; no CEP104, n = 41; no CSPP1, n = 141. For dynamic state (d), bars represent the averaged means from two independent experiments and error bars represent the s.e.m. ei, Fields of view (left; scale bar: 2 µm) and kymographs (middle, combined colors; right, CEP104 only; scale bars: 2 µm and 60 s) illustrating MT dynamics from GMPCPP-stabilized seeds with 20 nM GFP–EB3 (magenta) and CTM components indicated in a. j, Weighted growth rates (plotted as in c) for combinations of indicated CTM proteins (from kymographs in Extended Data Fig. 6h–k). Data were pooled from three independent experiments. Total number of growth events: 2 nM CEP104 with 2 nM CSPP1 and 10 nM TOGARAM1, n = 58; 2 nM CEP104 with 2 nM CSPP1 and 20 nM TOGARAM1, n = 88; 2 nM CEP104 with 0.5 nM CSPP1 and 20 nM TOGARAM1, n = 77; 0.5 nM CEP104 with 2 nM CSPP1 and 20 nM TOGARAM1, n = 228. Source data
Fig. 8
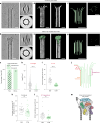
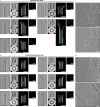
Fig. 8. CTM proteins form cork-like densities at MT plus ends and reduce protofilament flaring.
a,b, Left, slices (4.3 nm thick) of denoised tomograms showing MT plus ends grown in presence of EB3 alone (a) or CTM and EB3 (b). Right, an 8-nm-thick transverse cross-section of the corresponding MTs. The transverse cross-section (top right) is accompanied by its rotational average (bottom right) to indicate MT polarity. Scale bars: 25 nm. Independent experiments were run twice for controls and three time for CTM samples. c, Cork distribution in the CTM samples based on visual inspection for the presence of cork densities and based on chirality of the rotationally averaged cross-section for MT polarity. Total number of MT ends analyzed: plus ends, n = 60; minus ends, n = 38. d,e, The 3D rendered segmentation volumes of a free or dynamic MT plus end (d) and CTM-corked plus end (e). MT, gray; CTM density, green. Scale bars: 25 nm. f,g, A 3D model of manually traced protofilament shapes, accompanied by their transverse cross-sections. Scale bars: 25 nm. h, Distribution of protofilament length measured from the last segment within the MT wall until the tip of the protofilament. Total number of protofilaments analyzed: EB3, n = 329; CTM, n = 441. Lines represent the median (solid) and quartiles (dotted). ****P < 0.0001 (two-sided Mann–Whitney test). i, Protofilament length s.d. per MT. Total number of MTs analyzed: EB3, n = 26; CTM, n = 33. Bars represent the mean and error bars represent the s.e.m. ****P < 0.0001 (two-sided Mann–Whitney test). j, Schematic representation of parameters that were obtained from manual tracing of MT plus-end protofilaments. k, Average local protofilament curvature per MT. Total number of MTs analyzed: EB3, n = 25; CTM, n = 32. Bars represent the mean and error bars represent the s.e.m. **P = 0.0061 (two-sided Mann–Whitney test). l, MT raggedness plotted as s.d. of protofilament axial distance of last segment within the wall per MT. Total number of MTs analyzed: EB3, n = 26; CTM, n = 33. Bars represent the mean and error bars represent the s.e.m. **P = 0.002 (two-sided Mann–Whitney test). m, Schematic model of the CTM at an MT plus end. Source data
Extended Data Fig. 1
Extended Data Fig. 1. Characterization of CTM proteins in vitro.
a, Analysis of purified GFP-tagged CTM proteins by SDS-PAGE. Asterisks indicate the full-length protein bands. Protein concentrations were determined from a BSA standard. Assays were repeated independently at least two times. b, SEC-MALS analysis of purified GFP-tagged CTM proteins. The human sequence was used for all module members, except for TOGARAM1. Due to technical difficulties, the mouse sequence of TOGARAM1 was used, which is 84% identical to human TOGARAM1. c, Mass spectrometry analysis of purified GFP-tagged CTM proteins. d, Fields of view (top, scale bar 2 µm) and kymograph (bottom, scale bars 2 µm and 60 s) illustrating MT dynamics from GMPCPP-stabilized seed with HiLyte-488-tubulin and mCherry-CEP104. e, Kymographs illustrating mobility of DmKHC(1-421) on CEP104-blocked MT labelled with HiLyte-488-tubulin and mCherry-CEP104 (top) and DmKHC (bottom) proving that the blocked end of the MT is the plus end. Scale bars 2 µm and 60 s for both kymographs. Source data
Extended Data Fig. 2
Extended Data Fig. 2. Characterization of CEP104 constructs in vitro.
a, Analysis of purified GFP-tagged CEP104 constructs by SDS-PAGE. Asterisks show protein bands. Protein concentrations were determined from a BSA standard. Assays were repeated independently at least two times. b, Fields of view (left, scale bar 2 µm) and kymograph (right, scale bars 2 µm and 60 s) illustrating MT dynamics from GMPCPP-stabilized seed with either HiLyte-488-tubulin or GFP-EB3 and indicated concentrations and colors of CEP104 constructs. c, Co-immunoprecipitation of either CSPP1 (left) or CCDC66 (right) with indicated CEP104 constructs, both CSPP1 and CCDC66 interact with the jelly-roll domain of CEP104. Assays were repeated independently at least two times. d, Analysis of purified GFP-tagged CEP104 ΔJR construct by SDS-PAGE. Asterisk indicates the full-length protein band. Protein concentration was determined from a BSA standard. Assays were repeated independently at least two times. Source data
Extended Data Fig. 3
Extended Data Fig. 3. Characterization of TOGARAM1 constructs in vitro.
Analysis of purified GFP-tagged TOGARAM1 constructs by SDS-PAGE. Asterisks show protein bands. Protein concentrations were determined from a BSA standard. Assays were repeated independently at least two times. Source data
Extended Data Fig. 4
Extended Data Fig. 4. Mapping of ARMC9 and TOGARAM1 interaction.
a, Schematic representation of different ARMC9 constructs. Vertical lines indicate Joubert syndrome-linked point mutations. b, Histogram plots of fluorescent intensities of single GFP molecules, GFP-EB3 dimers, and full-length GFP-ARMC dimers (left) or GFP-ARMC9 ΔH molecules immobilized in separate chambers of the same coverslips. Number of molecules analyzed, left, right: GFP, n=18415, 14914; GFP-EB3, n= 132826, 163959; GFP-ARMC9 FL, n=99873; GFP-ARMC9 ΔH, 55479. c, Co-immunoprecipitation of full-length ARMC9 with indicated proteins. Assays were repeated independently at least two times. d, Fields of view (left, scale bar 2 µm) and kymograph (right, scale bars 2 µm and 60 s) illustrating MT dynamics from GMPCPP-stabilized seed with mCherry-EB3 and indicated concentrations and colors of CTM proteins. Assays were repeated independently three times. e, f, Co-immunoprecipitation experiments of either full-length TOGARAM1 with indicated ARMC9 constructs (e) or full-length ARMC9 with indicated TOGARAM1 point mutations (f). ARMC9 and TOGARAM1 interact through ARM domain and TOG2 domain, respectively. Assays were repeated independently at least two times. g, h, Co-immunoprecipitation experiments of either full-length TOGARAM1 with indicated ARMC9 Joubert syndrome mutations (g) or full-length ARMC9 with indicated TOGARAM1 Joubert syndrome mutations (h). Assays were repeated independently at least two times. Source data
Extended Data Fig. 5
Extended Data Fig. 5. Mapping of ARMC9 and CSPP1 interaction.
a, Co-immunoprecipitation experiment of full-length ARMC9 with indicated CSPP1 constructs illustrated in schematic below. Assays were repeated independently at least two times. b, Co-immunoprecipitation experiment of full-length CSPP1 with indicated ARMC9 constructs illustrated in Extended Data Fig. 4a. Assays were repeated independently at least two times. c, Fields of view (left, scale bar 2 µm) and kymographs (right, scale bars 2 µm and 60 s) illustrating MT dynamics from GMPCPP-stabilized seed with GFP-EB3 and indicated concentrations and colors of CSPP1 constructs. Assays were repeated independently three times. d, Co-immunoprecipitation experiment of full-length CSPP1 with full-length TOGARAM1 shows no interaction. Assays were repeated independently at least two times. e, Fields of view (left, scale bar 2 µm) and kymograph (right, scale bars 2 µm and 60 s) illustrating MT dynamics from GMPCPP-stabilized seed with GFP- or mCherry-EB3 and indicated concentrations and colors of CTM proteins. Assays were repeated independently three times. Source data
Extended Data Fig. 6
Extended Data Fig. 6. Mapping of CEP104 and TOGARAM1 interaction.
a, b, Co-immunoprecipitation of either wildtype CEP104 with indicated TOGARAM1 constructs (a) or wildtype TOGARAM1 with indicated CEP104 constructs (b), the two proteins interact between the linker of TOGARAM1 and the zinc finger of CEP104. Assays were repeated independently at least two times. c, Additional kymographs (scale bars 2 µm and 60 s) illustrating MT dynamics from GMPCPP-stabilized seed with GFP-EB3, mCherry-TOGARAM1, and GFP-CEP104. Assay was repeated independently three times. d, Kymographs illustrating mobility of DmKHC(1-421) on slow growing MT with all CTM proteins (top) and DmKHC (bottom) proving that the slow growing end of the MT is the plus end. Scale bars 2 µm and 60 s for both kymographs. Assay was repeated independently three times e, Additional kymographs (scale bars 2 µm and 60 s) illustrating MT dynamics from GMPCPP-stabilized seeds of the entire CTM with 20 nM GFP-EB3. Assay was repeated independently three times. f, FRAP analysis of CEP104 at slow growing MT plus ends with the entire CTM. Arrowhead marks point of photobleaching in representative kymograph (top), scale bars 2 µm and 60 s. Plot (bottom) show average curve with exponential fit. Number of FRAP measurements, n=19 Error bars represent s.e.m. Assay was repeated independently three times. g-k, Fields of view (left, scale bar 2 µm) and kymographs (right, scale bars 2 µm and 60 s) illustrating MT dynamics from GMPCPP-stabilized seeds with 20 nM GFP-EB3 and indicated concentrations and colors of CTM proteins. Assays were repeated independently three times. Source data
Extended Data Fig. 7
Extended Data Fig. 7. Characterization of MT plus ends by cryo-ET.
a, b, Representative examples of MT plus ends grown in presence of EB3 alone (a) or CTM and EB3 (b). Per MT, the following is shown from left to right; a slice of the denoised tomogram containing the MT plus end, an 8 nm thick transverse cross-section accompanied by rotational averaging analysis to determine MT polarity, and the corresponding 3D model of manual protofilament tracing accompanied by its transverse cross-section. Scale bars 25 nm. Independent experiments were run twice for controls and three time for CTM samples. c, d, Slices (4.3 nm thick) of denoised tomograms showing MTs grown in presence of EB3 alone (c) or the CTM and EB3 (d). Insets show a zoom of the indicated region. Scale bars 100 nm.

References

    1. Klena, N. & Pigino, G. Structural biology of cilia and intraflagellar transport. Annu. Rev. Cell Dev. Biol.38, 103–123 (2022). - PubMed
    1. Mill, P., Christensen, S. T. & Pedersen, L. B. Primary cilia as dynamic and diverse signalling hubs in development and disease. Nat. Rev. Genet.24, 421–441 (2023). - PMC - PubMed
    1. Hildebrandt, F., Benzing, T. & Katsanis, N. Ciliopathies. N. Engl. J. Med.364, 1533–1543 (2011). - PMC - PubMed
    1. Badano, J. L., Mitsuma, N., Beales, P. L. & Katsanis, N. The ciliopathies: an emerging class of human genetic disorders. Annu. Rev. Genomics Hum. Genet.7, 125–148 (2006). - PubMed
    1. Deretic, J., Odabasi, E. & Firat-Karalar, E. N. The multifaceted roles of microtubule-associated proteins in the primary cilium and ciliopathies. J. Cell Sci.136, jcs261148 (2023). - PubMed

MeSH terms

Substances

LinkOut - more resources