. 2025 Jan 24;8(1):50.
doi: 10.1038/s41746-024-01393-1.

A multimodal transformer system for noninvasive diabetic nephropathy diagnosis via retinal imaging

Affiliations

A multimodal transformer system for noninvasive diabetic nephropathy diagnosis via retinal imaging

Zheyi Dong et al. NPJ Digit Med. .

Abstract

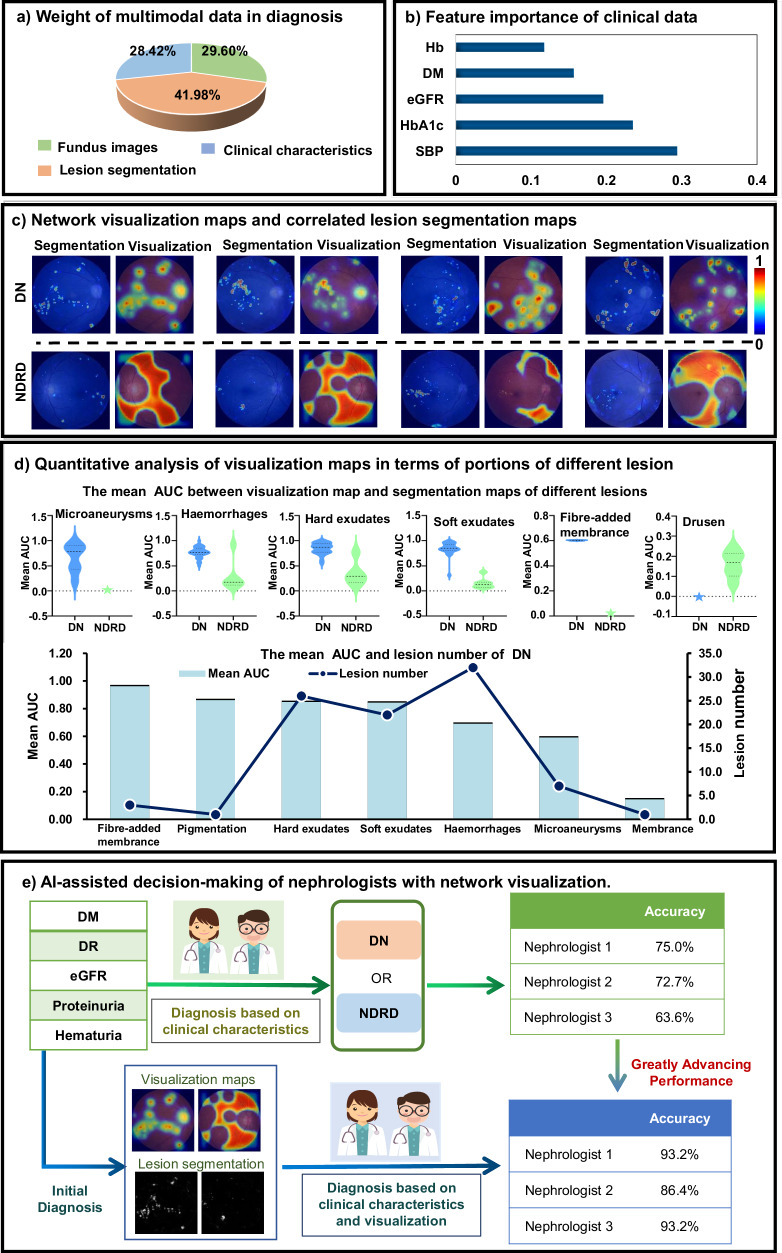
Differentiating between diabetic nephropathy (DN) and non-diabetic renal disease (NDRD) without a kidney biopsy remains a major challenge, often leading to missed opportunities for targeted treatments that could greatly improve NDRD outcomes. To reform the traditional biopsy-all diagnostic paradigm and avoid unnecessary biopsy, we developed a transformer-based deep learning (DL) system for detecting DN and NDRD upon non-invasive multi-modal data of fundus images and clinical characteristics. Our Trans-MUF achieved an AUC of 0.980 (95% CI: 0.979 to 0.980) over the internal retrospective set and also had superior generalizability over a prospective dataset (AUC: 0.989, 95% CI: 0.987 to 0.990) and a multicenter, cross-machine and multi-operator dataset (AUC: 0.932, 95% CI: 0.931 to 0.939). Moreover, the nephrologists' diagnosis accuracy can be improved by 21%, through visualization assistance of the DL system. This paper lays a foundation for automatically differentiating DN and NDRD without biopsy. (Registry name: Correlation Study Between Clinical Phenotype and Pathology of Type 2 Diabetic Nephropathy. ID: NCT03865914. Date: 2017-11-30).


Conflict of interest statement

Competing interests: The authors declare no competing interests.

Figures

Fig. 1
Fig. 1. Overview of the study.
a Comparison between the traditional paradigm and our AI-based diagnostic paradigms for the diagnosis of DN and NDRD. In contrast with the conventional paradigm, the proposed AI system can greatly improve the missed diagnosis rate of NDRD and reduce the number of kidney biopsies. b The pipeline of our AI system. With a multimodal input of retinal images, lesion segmented maps and risk factors, our AI system can generate a predicted probability of DN/NDRD, lesion segmented maps, subjective network visualization maps and a correlated quantitative analysis. It constructs a multimodal fusion network consisting of multiple models. c Personalized management analysis for our AI system. We simulated a scenario that assessed whether the AI system could correctly identify patients with DN from a mixed group of DN and NDRD to avoid biopsy for DN patients. This simulation included 55 patients from external validation set and used a decision curve analysis methodology. d Composition illustration of the data used in this study. e ROC curves of our AI model for different validation sets. AI, artificial intelligence; Seg, segmentation.
Fig. 2
Fig. 2. Illustration of the Trans-MUF system.
Taking the multi-modal input of fundus image and the clinical factors, the Trans-MUF system can output the DN/NDRD prediction result, as well as the auxiliary outputs of interpretable visualization map and pathology attributing score. Trans-MUF system is composed of three subnets, including a ImgLesion subnet b Factor subnet and c Diagnosis subnet.
Fig. 3
Fig. 3. Illustration of experimental results of disease classification and lesion segmentation.
a (Top row) The ROCs of our model, other compared models and human expert based on the three validation datasets. (Bottom row) The ROCs of our model and other ablated models based on the three validation datasets. b t-SNE visualization of the Trans-MUF system with the Retina-DKD validation set. c The performance analysis on the segmentation proportion in multi-modal concatenation (Top) and WAM block number (Bottom) during training. d (Lest to right) Subjective visualization of lesion segmentation of the annotated multi-lesion maps, binarized lesion maps, baseline model (i.e., single layer fusion) and our proposed model. e The performance analysis on the number of fusion layers in our proposed lesion segmentation model.
Fig. 4
Fig. 4. Model interpretability analysis.
a The weight of multimodal data in diagnosis. b The feature importance of clinical data. c Segmented lesion map and network visualization of DN and NDRD. d Violin plot of the average AUC between visualization maps and different lesion segmentation maps. The three lines in the violin plot from top to bottom are the 75% quartile, median and 25% quartile. e AI-assisted decision-making of nephrologists with network visualization.

References

    1. Thomas, M. C. et al. Diabetic kidney disease. Nat. Rev. Dis. Prim.1, 1–20 (2015). - PMC - PubMed
    1. Thomas, M. C., Weekes, A. J., Broadley, O. J., Cooper, M. E. & Mathew, T. H. The burden of chronic kidney disease in australian patients with type 2 diabetes (thenefron study). Med. J. Aust.185, 140–144 (2006). - PubMed
    1. Dwyer, J. P. et al. Renal dysfunction in the presence of normoalbuminuria in type 2 diabetes: results from the demand study. Cardiorenal Med.2, 1–10 (2012). - PMC - PubMed
    1. Iwai, T. et al. Diabetes mellitus as a cause or comorbidity of chronic kidney disease and its outcomes: the gonryo study. Clin. Exp. Nephrol.22, 328–336 (2018). - PubMed
    1. Anders, H.-J., Davis, J. M. & Thurau, K. Nephron protection in diabetic kidney disease. N. Engl. J. Med.375, 2096–2098 (2016). - PubMed

Associated data

LinkOut - more resources