. 2025 Feb;6(2):385-403.
doi: 10.1038/s43018-024-00900-3. Epub 2025 Jan 24.

TRIM28-dependent developmental heterogeneity determines cancer susceptibility through distinct epigenetic states

Collaborators, Affiliations

TRIM28-dependent developmental heterogeneity determines cancer susceptibility through distinct epigenetic states

Ilaria Panzeri et al. Nat Cancer. 2025 Feb.

Abstract

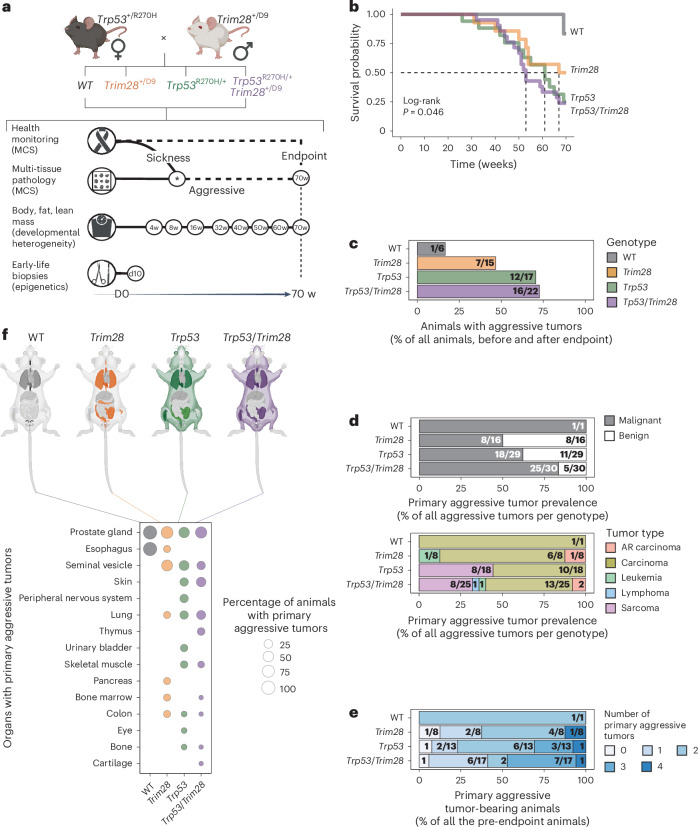
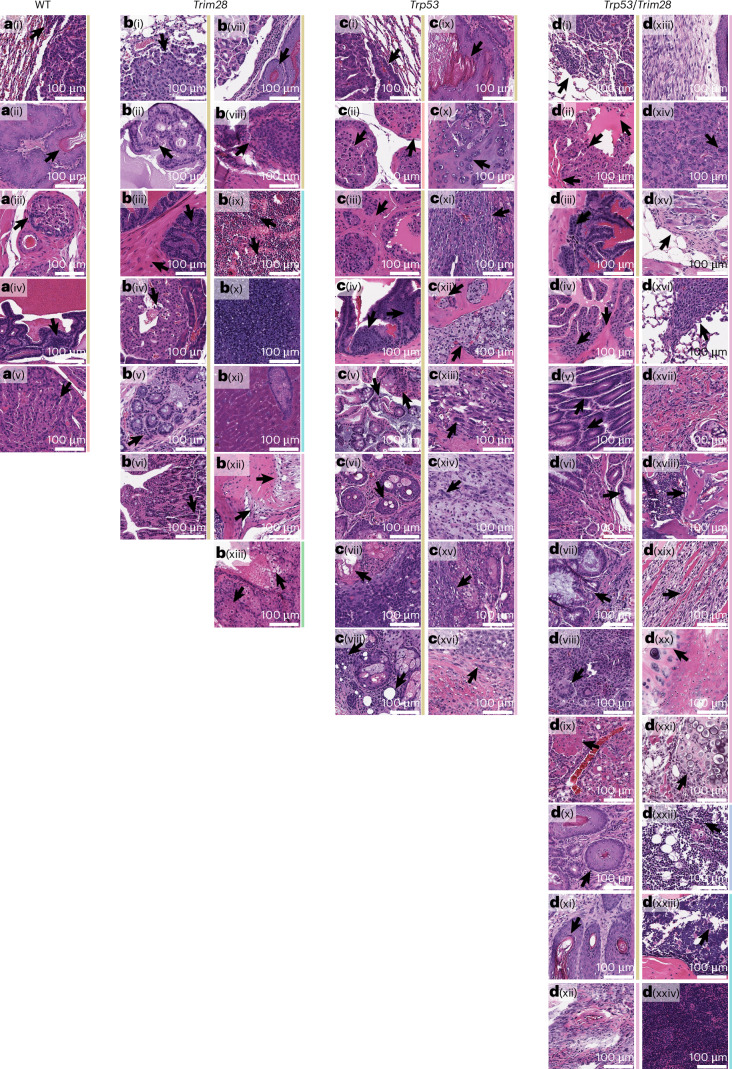
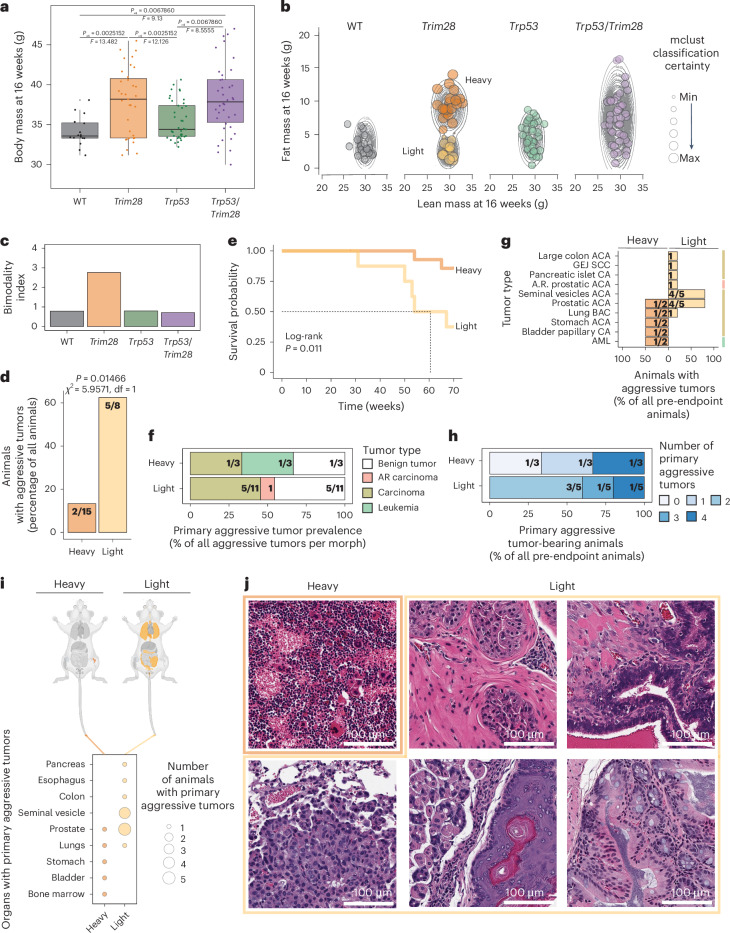
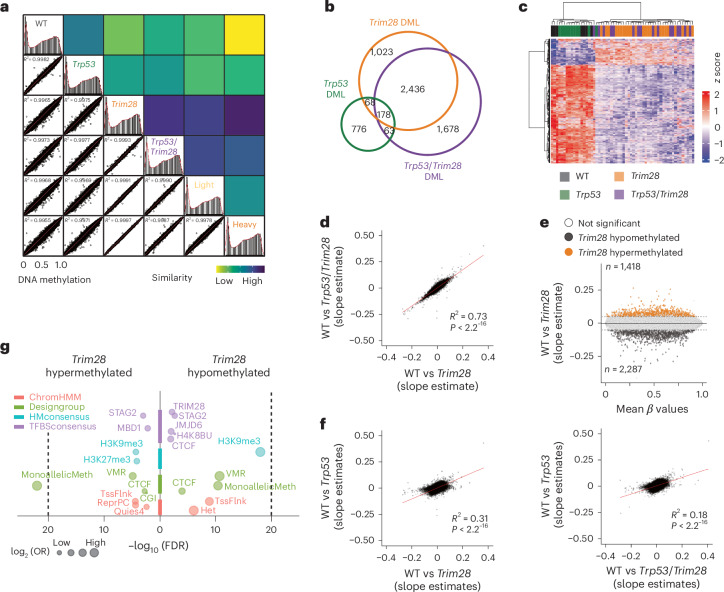
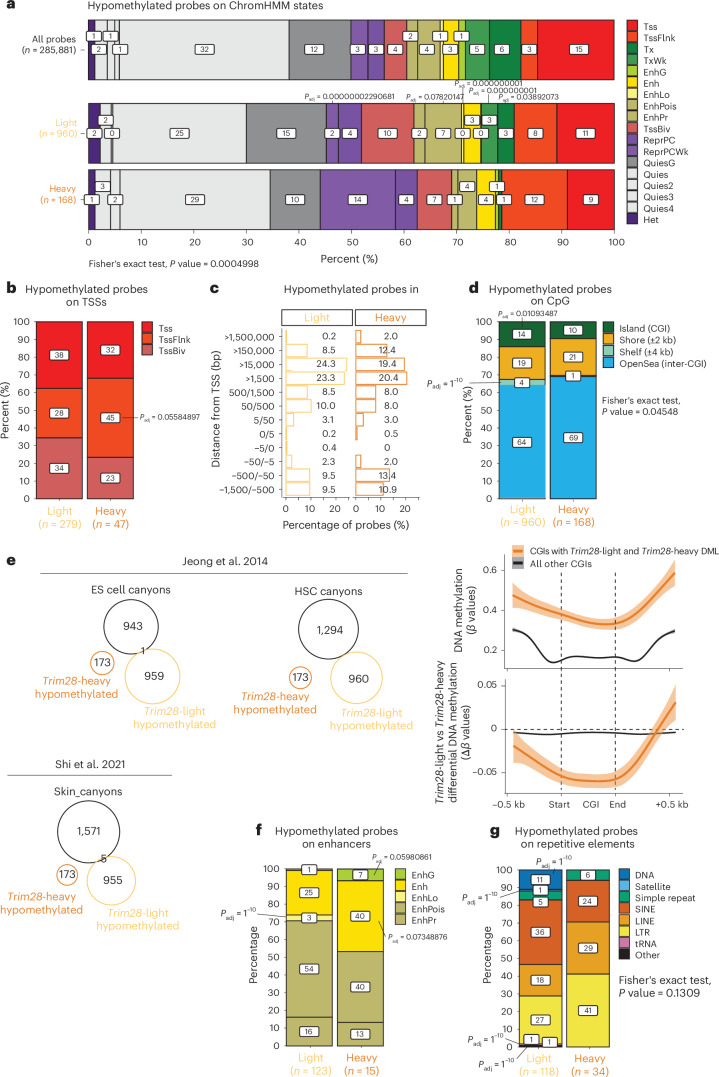
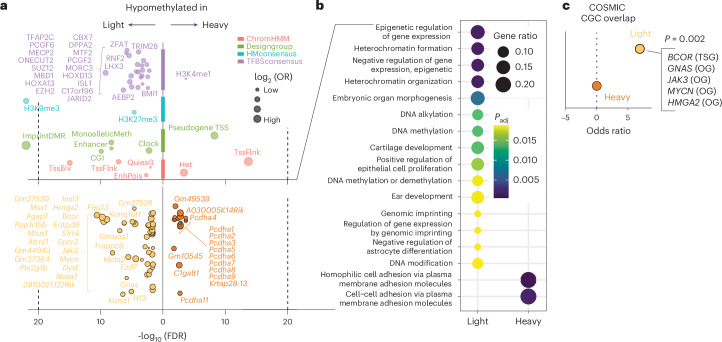
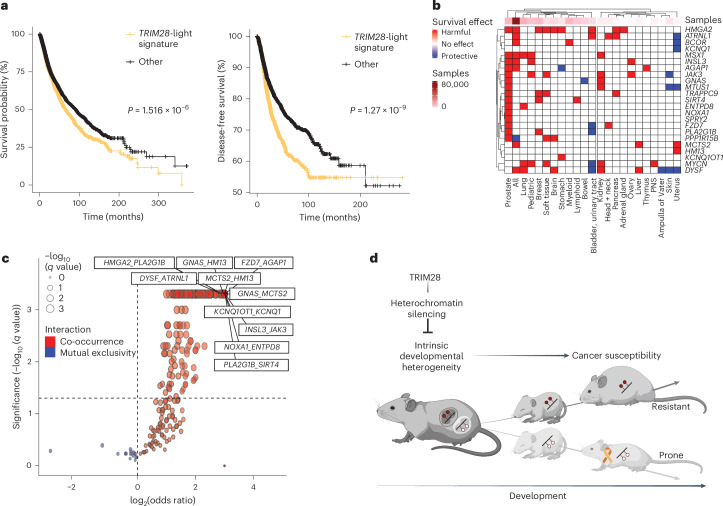
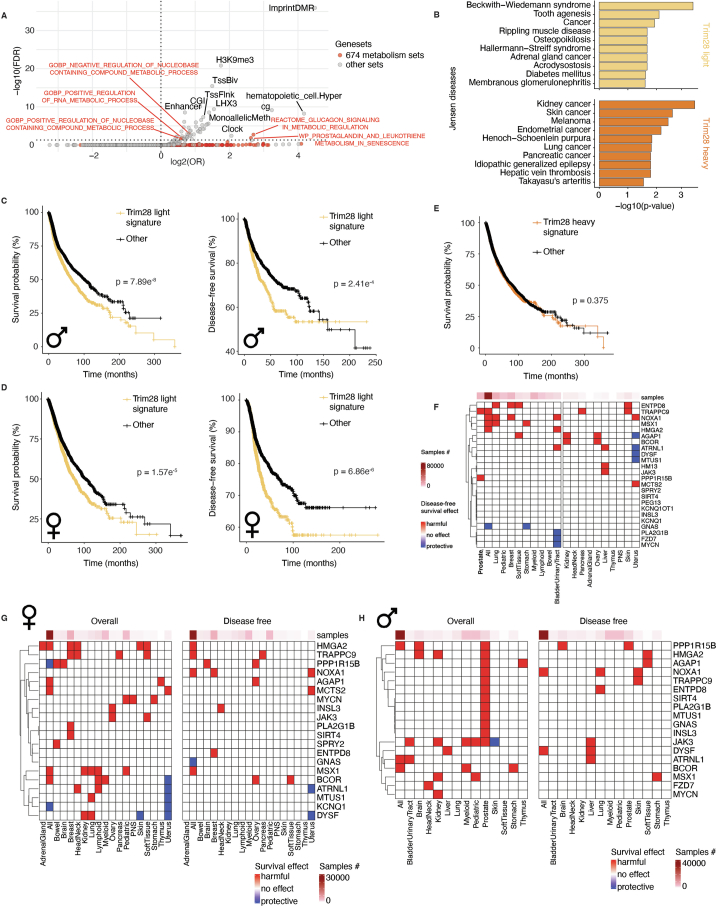
Mutations in cancer risk genes increase susceptibility, but not all carriers develop cancer. Indeed, while DNA mutations are necessary drivers of cancer, only a small subset of mutated cells go on to cause the disease. To date, the mechanisms underlying individual cancer susceptibility remain unclear. Here, we took advantage of a unique mouse model of intrinsic developmental heterogeneity (Trim28+/D9) to investigate whether early-life epigenetic variation influences cancer susceptibility later in life. We found that heterozygosity of Trim28 is sufficient to generate two distinct early-life epigenetic states associated with differing cancer susceptibility. These developmentally primed states exhibit differential methylation patterns at typically silenced heterochromatin, detectable as early as 10 days of age. The differentially methylated loci are enriched for genes with known oncogenic potential, frequently mutated in human cancers and correlated with poor prognosis. This study provides genetic evidence that intrinsic developmental heterogeneity can prime individual, lifelong cancer susceptibility.


Conflict of interest statement

Competing interests: The authors declare no competing interests.

Figures

Fig. 1
Fig. 1. Trim28+/D9 mice exhibit MCS.
a, Schematic of the experimental plan. The Trp53+/R270H MCS model was mated with the Trim28+/D9 developmental heterogeneity model. F1 genotypes were screened for health issues and tumor development. Tissues were collected before (aggressive) or at the endpoint of the study (70 weeks (w)). Histopathology determined the presence of tumors. Body, fat and lean mass was measured at multiple time points. Early-life biopsies were collected at day (D) 10 (before weaning). b, Kaplan–Meier survival probability by genotype. Log-rank test, P = 0.046. n = 60 male mice screened for cancer (6 wild type (WT), 15 Trim28+/D9, 17 Trp53R270H/+, 22 Trp53R270H/+;Trim28+/D9). c, Prevalence of male mice with aggressive tumors, as percentage relative to total screened males in each genotype (before and after endpoint). Actual numbers are given in fractions. n = 60 males (6 WT, 15 Trim28+/D9, 17 Trp53R270H/+, 22 Trp53R270H/+;Trim28+/D9). d, Top, prevalence of malignant (gray) or benign (white) aggressive tumors (before endpoint) for each genotype, as a percentage relative to total aggressive tumors by genotype. Actual numbers are given in fractions. n = 76 malignant and benign aggressive tumors (1 in WT, 16 in Trim28+/D9, 29 in Trp53R270H/+, 30 in Trp53R270H/+;Trim28+/D9). Bottom, prevalence of distinct malignant aggressive tumor types (before endpoint) in each genotype as a percentage relative to total malignant aggressive tumors (before endpoint). Actual numbers are given in fractions (if the denominator is not specified due to space constraints, consider it the same within each genotype). n = 52 malignant aggressive tumors (1 in WT, 8 in Trim28+/D9, 18 in Trp53R270H/+, 25 in Trp53R270H/+;Trim28+/D9). AR, age-related e, Fraction of mice with 0, 1 or multiple malignant aggressive tumors (before endpoint), relative to total pre-endpoint mice. Actual numbers are given in fractions (if the denominator is not specified due to space constraints, consider it the same within each genotype). n = 39 pre-endpoint mice (1 WT, 8 Trim28+/D9, 13 Trp53R270H/+, 17 Trp53R270H/+;Trim28+/D9). f, Tissues affected by malignant aggressive tumors (before endpoint). Top, mouse anatomy plots; nontargeted tissues are in light gray, and targeted tissues are colored by genotype: WT (black), Trim28+/D9 (orange), Trp53R270H/+ (green), Trp53R270H/+;Trim28+/D9 (purple). Bottom, percentage of mice with organs targeted by malignant aggressive tumors (before endpoint) by genotype. n = 39 pre-endpoint mice (1 WT, 8 Trim28+/D9, 13 Trp53R270H/+, 17 Trp53R270H/+;Trim28+/D9). Panels a,f (top) created with BioRender.com. Source data
Fig. 2
Fig. 2. Representative histological examples of tumor types for all genotypes and time points.
Arrows indicate main features of each tumor type. Tumor categories are color coded on the right: age-related carcinoma (red), carcinoma (gold), leukemia (light green), lymphoma (light blue), sarcoma (pink), germ cell tumors (dark green). a, WT male mice. a(i), Bronchoalveolar carcinoma (BAC). a(ii), Gastro-esophageal junction SCC. a(iii), Prostatic carcinoma (PCa). a(iv), Seminal vesicle carcinoma. a(v), Age-related PCa. b, Trim28+/D9 male mice. b(i), BAC. b(ii), PCa. b(iii), Seminal vesicle carcinoma. b(iv), Pancreatic carcinoma. b(v), Large colon ACA. b(vi), Small bowel carcinoma. b(vii), Gastro-esophageal junction SCC. b(viii), Bladder transitional cell carcinoma. b(ix), AML affecting the bone marrow. b(x), AML spreading to the spleen. b(xi), AML spreading to the liver. b(xii), Synovial sarcoma. b(xiii), Seminoma. c, Trp53R270H/+ male mice. c(i), BAC. c(ii), Age-related PCa. c(iii), PCa. c(iv), Seminal vesicle carcinoma. c(v), Large colon ACA. c(vi), Skin SCC. c(vii), Preputial gland SCC. c(viii), Adenoid cystic carcinoma. c(ix), Gastro-esophageal junction SCC. c(x), Osteosarcoma. c(xi), Fibrosarcoma. c(xii), Chondrosarcoma. c(xiii), Rhabdomyosarcoma. c(xiv), Malignant peripheral nerve sheath tumor. c(xv), Sarcoma affecting the preputial glands. c(xvi), Dermatofibrosarcoma protuberans. d, Trp53R270H/+;Trim28+/D9 male mice. d(i), BAC. d(ii), PCa. d(iii), Seminal vesicle carcinoma. d(iv), Age-related PCa. d(v), Gastro-esophageal junction ACA. d(vi), Duodenal carcinoma. d(vii), Colorectal carcinoma. d(viii), Thymic carcinoma. d(ix), Hepatoid ACA of the lung. d(x), Gastro-esophageal junction SCC. d(xi), Skin SCC. d(xii), Dermatofibrosarcoma protuberans. d(xiii), Soft tissue sarcoma. d(xiv), Epithelioid fibrohistiocytic sarcoma. d(xv), Skin appendage tumor. d(xvi), Metastatic fibrosarcoma to the lungs. d(xvii), Fibrosarcoma. d(xviii), Osteosarcoma. d(xix), Rhabdomyosarcoma. d(xx), Chondrosarcoma in the bone. d(xxi), Chondrosarcoma spreading to soft tissue. d(xxii), T cell lymphoma. d(xxiii), Acute lymphoblastic leukemia affecting the bone marrow. d(xxiv), Acute lymphoblastic leukemia spreading to the spleen.
Fig. 3
Fig. 3. TRIM28-dependent developmental heterogeneity primes cancer outcomes.
a, Body mass distribution at 16 weeks by genotype. Each dot represents one male. Box plots show 25th, 50th (median) and 75th percentiles, with whiskers extending to 1.5 × interquartile range of the hinge and outliers plotted individually. Two-sided Levene’s test, Benjamini–Hochberg adjusted. Significance for adjusted P value (Padj) < 0.05: WT versus Trim28+/D9, Padj = 0.0025152 (F = 13.482); WT versus Trp53R270H/+, Padj = 0.2031600 (F = 1.9399); WT versus Trp53R270H/+;Trim28+/D9, Padj = 0.0067860 (F = 9.13); Trim28+/D9 versus Trp53R270H/+, Padj = 0.0025152 (F = 12.126); Trim28+/D9 versus Trp53R270H/+;Trim28+/D9, Padj = 0.8220000 (F = 0.051); Trp53R270H/+;Trim28+/D9 versus Trp53R270H/+, Padj = 0.0067860 (F = 8.5555). n = 130 male mice (16 WT, 35 Trim28+/D9, 41 Trp53R270H/+, 38 Trp53R270H/+;Trim28+/D9). b, Fat and lean mass data at 16 weeks by genotype, with overlaid mclust density estimation. Each dot represents one male; dot size is proportional to mclust classification certainty. n = 138 male mice (18 WT, 36 Trim28+/D9, 43 Trp53R270H/+, 41 Trp53R270H/+;Trim28+/D9). c, Bimodality index: ratio of mclust-determined Bayesian information criterion (BIC) for two clusters over one from fat and lean mass data at 16 weeks. n = 138 male mice (same as in b: 18 WT, 36 Trim28+/D9, 43 Trp53R270H/+, 41 Trp53R270H/+;Trim28+/D9). d, Proportion of Trim28+/D9-heavy and Trim28+/D9-light males with malignant aggressive tumors as a percentage of males per group (before and after endpoint). Actual numbers are given in fractions. Two-sided two-sample test for equality of proportions without continuity correction; significance for P < 0.05: heavy versus light, P = 0.01466, χ2 = 5.9571, degrees of freedom (df) = 1. n = 23 male mice (15 heavy, 8 light). e, Kaplan–Meier survival probability of Trim28+/D9-heavy and Trim28+/D9-light mice. Log-rank test, P = 0.011. n = 23 males (15 heavy, 8 light). f, Prevalence of aggressive tumor types in Trim28+/D9-heavy and Trim28+/D9-light mice as a percentage of total aggressive tumors per group. Actual numbers are shown in fractions. n = 14 tumors (malignant and benign; 3 in heavy and 11 in light). g, Distribution of tumor types in Trim28+/D9-heavy and Trim28+/D9-light mice, as a percentage of mice with malignant aggressive tumors per group. Actual numbers are shown in fractions. Right, age-related carcinoma (red), carcinoma (gold), leukemia (light green). CA, carcinoma; GEJ, gastro-esophageal junction. n = 7 males (2 heavy, 5 light). h, Fraction of Trim28+/D9-heavy and Trim28+/D9-light mice with 0 or multiple malignant aggressive tumors. Actual numbers are shown in fractions. n = 8 males (3 heavy, 5 light). i, Tissues targeted by malignant aggressive tumors by genotype. Top, mouse anatomy plots; nontargeted tissues are in light gray, and targeted tissues are colored by genotype: WT (black), Trim28+/D9 (orange), Trp53R270H/+ (green), Trp53R270H/+;Trim28+/D9 (purple). Bottom, organs with malignant aggressive tumors by morph. n = 7 males (2 heavy, 5 light). j, Histological examples of aggressive malignant tumors in Trim28+/D9-heavy and Trim28+/D9-light mice. Top left, AML, heavy (as in Fig. 2). Top middle, prostatic ACA, light. Top right, seminal vesicle ACA, light. Bottom left, BAC, light. Bottom middle, gastro-esophageal junction SCC, light. Bottom right, colon ACA, light. n = 7 males (2 heavy, 5 light). Panel i, top created with BioRender.com. Source data
Fig. 4
Fig. 4. Trim28+/D9 effects on early-life epigenomes.
a, Right, correlation plots comparing global DNA methylation on all available probes among all genotypes and Trim28+/D9-heavy and Trim28+/D9-light morphs as the sum of squared residuals from linear regressions. Left, density plots of β-value distribution for all genotypes and trajectories. R2 values derive from Pearson correlations. n = 58 (7 WT, 24 Trim28+/D9, 11 Trp53R270H/+, 16 Trp53R270H/+;Trim28+/D9). b, Overlap of DML between Trim28+/D9, Trp53R270H/+;Trim28+/D9, Trp53R270H/+ and WT mice. n = 58 (7 WT, 24 Trim28+/D9, 11 Trp53R270H/+, 16 Trp53R270H/+;Trim28+/D9). c, Heatmap of the z score of log1p-transformed β values of differentially methylated probes in all genotypes relative to WT mice. Effect size cutoff = 0.1; P-value cutoff = 0.05 by t-testing slope estimates. n = 58 (7 WT, 24 Trim28+/D9, 11 Trp53R270H/+, 16 Trp53R270H/+;Trim28+/D9). d, Correlation plot comparing DNA methylation levels (slope estimate) on all available probes in WT versus Trp53R270H/+;Trim28+/D9 and WT versus Trim28+/D9 mice. R2 value = 0.73; P < 2.2−16 (two-sided Pearson correlation). n = 58 (7 WT, 24 Trim28+/D9, 11 Trp53R270H/+, 16 Trp53R270H/+;Trim28+/D9). e, M (slope intercept) A (average mean β-value) plot of differential DNA methylation levels (slope estimate) in WT versus Trim28+/D9 mice. n = 31 (7 WT, 24 Trim28+/D9). Black and orange dots represent hypomethylated and hypermethylated probes in Trim28+/D9 mice, 2,287 and 1,418 probes respectively. White dots are nonsignificant DML (estimate and P-value cutoff = 0.05). f, Correlation plots comparing DNA methylation levels (slope estimate) on all available probes in WT versus Trp53R270H/+ (left) and WT versus Trp53R270H/+;Trim28+/D9 mice (right). R2 values = 0.31 and 0.18; P < 2.2−16 (two-sided Pearson correlation). n = 58 male mice (7 WT, 24 Trim28+/D9, 11 Trp53R270H/+, 16 Trp53R270H/+;Trim28+/D9). g, Enrichment plots of features for Trim28+/D9-dependent differentially methylated probes. H3K27me3, histone H3 Lys27 trimethylation; H4K8BU, histone H4 Lys8 butyrylation; Het, heterochromatin; MonoallelicMeth, monoallelic methylation; OR, odds ratio; Quies, quiescent gene; ReprPC, repressed by Polycomb; TssFlnk, flanking active TSS; VMR, variably methylated regions. False discovery rate (FDR) cutoff = 0.01 (one-tailed Fisher’s exact test). n = 58 male mice (7 WT, 24 Trim28+/D9, 11 Trp53R270H/+, 16 Trp53R270H/+;Trim28+/D9). Source data
Fig. 5
Fig. 5. Trim28+/D9-dependent cancer susceptibility states are distinguished by distinct early-life epigenomes.
a, Heatmap reporting z-score transformed β values of differentially methylated probes in Trim28+/D9-heavy versus Trim28+/D9-light mice. Effect size cutoff = 0.05; P-value cutoff = 0.001 by t-testing the slope estimates. n = 24 male mice (15 Trim28+/D9-heavy, 9 Trim28+/D9-light). b, MA plot of differential DNA methylation levels (slope estimate) in Trim28+/D9-heavy versus Trim28+/D9-light male mice. Dark and light orange dots represent hypermethylated and hypomethylated probes in Trim28+/D9-light mice, respectively (estimate and P-value cutoff = 0.05 by t-testing the slope estimates). White dots are not significant. n = 24 male mice (15 heavy, 9 light). c, Weight at day 10 of Trim28+/D9-light and Trim28+/D9-heavy male mice used for DNA methylation array experiments. n = 24 male mice (15 heavy, 9 light). P value = 0.089 (unpaired two-sample Wilcoxon test). d, Enrichment plot of Trim28+/D9-light hypomethylated probes in Trim28+/D9-light versus Trim28+/D9-heavy male mice in the indicated tissues. FDR cutoff = 0.01 (one-tailed Fisher’s exact test). n = 46 tissues (12 pancreata, 12 lungs, 11 stomachs, 11 intestines). e,f, Scatterplots showing the correlation by genotype between the average level of DNA methylation on the indicated probe sets (Trim28+/D9-light or Trim28+/D9-heavy hypomethylated probes) and fat mass at 16 weeks. Colors indicate the morphs: Trim28+/D9-light (light orange) and Trim28+/D9-heavy mice (dark orange). n = 58 male mice (7 WT, 24 Trim28+/D9, 11 Trp53R270H/+, 16 Trp53R270H/+;Trim28+/D9). Source data
Fig. 6
Fig. 6. Characterization of Trim28+/D9-light and Trim28+/D9-heavy differentially methylated probes.
a, Stacked bar plots showing the distribution of hypomethylated probes from Trim28+/D9-light and Trim28+/D9-heavy male mice across ChromHMM states. Statistical significance was assessed using a two-sided Fisher’s exact test with a simulated P value (based on 2,000 replicates); P = 0.0005. Asterisks mark regions enriched in either Trim28+/D9-light or Trim28+/D9-heavy hypomethylated probes, with statistical significance determined by a hypergeometric test and FDR correction (Padj < 0.1). The overall distribution of all array probes is included for comparison. n = 24 male mice (15 heavy, 9 light). Tss, active TSS; Tx, transcription; TxWk, weak transcription; EnhG, genic enhancer; Enh, enhancer; EnhLo, weak enhancer; EnhPois, poised enhancer; EnhPr, primed enhancer; TssBiv, bivalent TSS; ReprPCWk, repressed by Polycomb, weak. b, Stacked bar plots display the distribution of hypomethylated probes across TSSs, with adjusted P values indicating regions enriched in Trim28+/D9-light and Trim28+/D9-heavy probes. Statistical significance was determined by a one-sided hypergeometric test with FDR correction (Padj < 0.1). n = 24 male mice (15 heavy, 9 light). c, Bar plots showing the distribution of Trim28+/D9-light and Trim28+/D9-heavy hypomethylated probes relative to TSSs. n = 24 male mice (15 heavy, 9 light). d,f,g, Stacked bar plots representing the distribution of hypomethylated probes across enhancers (d), CGIs (f) and repetitive elements (g). SINE, short interspersed nuclear element; LINE, long interspersed nuclear element; LTR, long terminal repeat; tRNA, transfer RNA. Statistical significance was assessed using Fisher’s exact test with a simulated P value and the hypergeometric test with FDR correction (Padj < 0.1). n = 24 male mice (15 heavy, 9 light). d, Bottom, DNA methylation levels in Trim28+/D9-light and Trim28+/D9-heavy male mice at CGIs with DML (orange) and other CGIs (black), presented with linear model smooth lines and 0.95 confidence intervals (‘lm’ method). e, Overlap of hypomethylated probes from Trim28+/D9-light and Trim28+/D9-heavy mice with annotated DNA methylation canyons in embryonic stem (ES) cell, hematopoietic stem cells (HSCs) and mouse skin. n = 24 male mice (15 heavy, 9 light). Source data
Fig. 7
Fig. 7. Trim28+/D9-dependent early-life epigenomes are enriched for epigenetic regulators and bona fide oncogenes.
a, Enriched features (top) and genes (bottom) for probes differentially methylated between Trim28+/D9-heavy and Trim28+/D9-light mice. H3K4me1, histone H3 Lys4 monomethylation. Bottom, the number of genes found differentially methylated is reported for Trim28+/D9-heavy and Trim28+/D9-light mice. FDR cutoff = 0.01 (one-tailed Fisher’s exact test). b, Gene Ontology enrichment plot of biological processes enriched in DML between Trim28+/D9-heavy versus Trim28+/D9-light mice. The size of the dots represents the gene ratio, while the color represents the Padj value for each term; Fisher’s exact test P value with Benjamini–Hochberg adjustment for multiple comparisons, cutoff = 0.05. The number of total genes analyzed in each group is reported. c, Odds ratio from one-sided Fisher’s exact tests, testing the statistical significance of enrichment between genes enriched by hypomethylated probes in Trim28+/D9-heavy (dark orange) and Trim28+/D9-light mice (light orange) and the COSMIC Cancer Gene Census (CGC; https://cancer.sanger.ac.uk/census). OG, oncogene; TSG, tumor-suppressor gene. P = 0.0002. In ac, n = 24 male mice (15 Trim28+/D9-heavy, 9 Trim28+/D9-light). Source data
Fig. 8
Fig. 8. Trim28+/D9-light hypomethylated signature genes are associated with reduced survival probability in humans.
a, Left, Kaplan–Meier survival probability as a percentage of the total population and time of survival in months. Log-rank test, P = 1.516 × 10−6. Total samples analyzed, 10,967. Right, Kaplan–Meier disease-free survival probability. Log-rank test, P = 1.27 × 10−9. Left and right, all TCGA Pan-Cancer Atlas patients with mutations in genes from the TRIM28+/D9-light hypomethylated signature (light orange, n = 3,766 samples) are compared to individuals without mutations in the same genes (black, n = 7,180 samples). b, Heatmap of the effects on overall survival probability of mutations in the indicated genes and tumor tissues. The analysis includes all samples from TCGA and non-TCGA studies with no overlapping samples, from cBioPortal (n = 69,223 samples). Tumor tissues are separated in two main branches according to sample number informing the analysis (left, >3,000 samples; right, <3,000 samples). PNS, peripheral nervous system. c, Volcano plot showing the type of interaction for pairwise mutations in genes from the TRIM28+/D9-light hypomethylated signature in all TCGA Pan-Cancer Atlas patients. Red indicates co-occurrence, and blue indicates mutual exclusivity of pairwise mutations. One-sided Fisher’s exact test, Benjamini–Hochberg Padj cutoff = 0.05. Total samples analyzed, 10,967. d, Our model suggests that TRIM28 buffers intrinsic developmental heterogeneity via heterochromatin silencing. By modulating a differentially methylated cancer-related gene set, it primes two distinct developmental trajectories for cancer susceptibility and outcomes, with one of the trajectories being more resistant and the other prone to cancer. Created with BioRender.com. Source data
Extended Data Fig. 1
Extended Data Fig. 1. Trim28+/D9 male mice exhibit multi-cancer syndrome.
Shading represents data from endpoint tumors. a) Distribution of genotypes in the F1 male population. N = 172 male mice. b) Prevalence of malignant (black) or benign (white) endpoint tumors by genotype, as percentage of total endpoint tumors per genotype. N=37 malignant and benign endpoint tumors in male mice (8 in WT, 12 in Trim28+/D9, 7 in Tp53R270H/+, 10 in Tp53R270H/+;Trim28+/D9). c) Tissues targeted by malignant endpoint tumors. Top: mouse anatomy plots; non-targeted tissues in light-grey and targeted tissues colored by genotype: WT (black), Trim28+/D9 (orange), Tp53R270H/+ (green), Tp53R270H/+;Trim28+/D9 (purple). Bottom: percentage of male mice with specific organs targeted by malignant endpoint tumors in the different genotypes, as percentage of total animals with malignant endpoint tumors. N=19 mice with malignant endpoint tumors (4 WT, 7 Trim28+/D9, 3 Tp53R270H/+, 5 Tp53R270H/+;Trim28+/D9). d) Prevalence of malignant endpoint tumor types by genotype, as percentage of malignant endpoint tumors in each genotype. N=27 total malignant endpoint tumors in male mice (5 in WT, 10 in Trim28+/D9, 6 in Tp53R270H/+, 6 in Tp53R270H/+;Trim28+/D9). e) Fraction of animals with 0 or multiple malignant endpoint tumors by genotype, as percentage of male mice screened at the endpoint. N=21 endpoint mice (5 WT, 6 Trim28+/D9, 4 Tp53R270H/+, 5 Tp53R270H/+;Trim28+/D9). f) Prevalence of malignant tumor types by genotype, divided into aggressive (left) and endpoint (right), as percentage of total number male mice with aggressive or endpoint tumors, respectively. N=36 male mice with aggressive tumors (1 WT, 7 Trim28+/D9, 12 Tp53R270H/+, 16 Tp53R270H/+;Trim28+/D9), N=19 with endpoint tumors (4 WT, 7 Trim28+/D9, 3 Tp53R270H/+, 5 Tp53R270H/+;Trim28+/D9). Tumor categories are color-coded on the right: age-related carcinoma (red); carcinoma (gold); leukemia (light-green); lymphoma (light-blue); sarcoma (pink); germ-cell tumors (dark-green). Panel c, top created with BioRender.com. Source data
Extended Data Fig. 2
Extended Data Fig. 2. TRIM28 buffers developmental heterogeneity.
Each dot represents one animal mouse in all scatter plots. a) Scatter plots and smoothed conditional means (95% confidence interval, ‘loess’ method) for fat (top) and lean (bottom) mass in male mice. Trim28+/D9 mice are divided into two clusters (dark- and light orange, for -heavy and -light, respectively); other genotypes have one cluster. GAM and emmeans analysis comparing Trim28+/D9-heavy vs -light. Significance for padj<0.0. Top, fat mass: p<0.0001 overall. p<0.0001 at 16, 32, 40 weeks (w); p=0.0005693 at 50w. Bottom, lean mass: p<0.0001 overall. p=0.0000099 at 32w, p=0.0000036 at 40w, p<0.0001 at 50w, p=0.0000085 at 60w, and p=0.0001194 at 70w. N=138 male mice (18 WT, 36 Trim28+/D9, 43 Tp53R270H/+, 41 Tp53R270H/+;Trim28+/D9). b) Mean and standard deviation (SD) of scaled Bayesian Information Criterion (BIC) for the 10 models MClust tested for each cluster number (component) and genotype, run on same data as Fig. 2b. N=138 male mice (18 WT, 36 Trim28+/D9, 43 Tp53R270H/+, 41 Tp53R270H/+;Trim28+/D9). c) Fat and lean mass at 16 weeks for males by genotype. Dot size proportional to MClust classification certainty, run on same data as Fig. 2b. N=138 male mice (18 WT, 36 Trim28+/D9, 43 Tp53R270H/+, 41 Tp53R270H/+;Trim28+/D9). d) Fat and lean mass at 16 weeks for females by genotype, with overlaid density estimation by MClust. Dot size proportional to MClust classification certainty. N=133 female mice (30 WT, 32 Trim28+/D9, 36 Tp53R270H/+, 35 Tp53R270H/+;Trim28+/D9). e) Bimodality index: ratio of MClust-determined BIC for 2 vs 1 cluster at 16 weeks, run on same data as Extended Data Fig. 3d. N=133 female mice (30 WT, 32 Trim28+/D9, 36 Tp53R270H/+, 35 Tp53R270H/+;Trim28+/D9). f) Mean and SD of scaled BIC. N=133 female mice (30 WT, 32 Trim28+/D9, 36 Tp53R270H/+, 35 Tp53R270H/+;Trim28+/D9). g) Fat and lean mass at 16 weeks for females by genotype. Dot size proportional to MClust classification certainty, run on same data as Extended Data Fig. 3d. N=133 female mice (30 WT, 32 Trim28+/D9, 36 Tp53R270H/+, 35 Tp53R270H/+;Trim28+/D9). h) Kaplan-Meier survival probability by genotype. Log-rank test, p=0.00053. N=78 female mice (9 WT, 12 Trim28+/D9, 27 Tp53R270H/+, 30 Tp53R270H/+;Trim28+/D9). i) Prevalence of female mice with aggressive tumors by genotype, as percentage of animals with aggressive (pre-endpoint) tumors over total screened animals. Actual numbers in fractions. N=78 female mice (9 WT, 12 Trim28+/D9, 27 Tp53R270H/+, 30 Tp53R270H/+;Trim28+/D9). Source data
Extended Data Fig. 3
Extended Data Fig. 3. TRIM28-dependent developmental heterogeneity primes cancer outcomes.
Endpoint data shaded. a) Proportion of Trim28+/D9-heavy and -light males with malignant aggressive or endpoint tumors, as percentage of tumor-bearing animals per group. Actual numbers in fractions. Two-sided two-sample test for equality of proportions without continuity correction, significance for p<0.05: aggressive tumors, p=0.01466, χ2=5.9571, df=1; endpoint tumors, p=0.04153, χ2=4.1544, df=1. N=23 male mice (15 -heavy, 8 -light). b) Tissues with malignant endpoint tumors across genotypes. Top: mouse anatomy plots; non-targeted tissues in light-grey and targeted tissues colored by genotype: WT (black), Trim28+/D9 (orange), Tp53R270H/+ (green), Tp53R270H/+;Trim28+/D9 (purple). Bottom: organs with tumors in each morph. N=15 male mice (12 -heavy, 3 -light). c) Prevalence of endpoint tumor types in Trim28+/D9-heavy and -light male animals, as percentage of total endpoint tumors per group. Actual numbers in fractions. N=28 endpoint tumors (malignant and benign, 22 in -heavy and 6 in -light). d) Distribution of malignant endpoint tumor types in Trim28+/D9-heavy and -light male mice, as percentages of total malignant endpoint tumor-bearing animals in each group. Tumor categories are color-coded on the right: age-related carcinoma (red); carcinoma (gold); leukemia (light-green); sarcoma (pink); germ-cell tumors (dark-green); other (teal). N=15 male mice (12 -heavy, 3 -light) e) Fraction of Trim28+/D9-heavy and -light males with 0 or multiple malignant endpoint tumors. Actual numbers in fractions. N=15 male mice (12 -heavy, 3 -light). f) Top: boxplots of nuclear TRIM28 mean fluorescence intensity (MFI) across genotypes and tissues. Two-sided Kruskal-Wallis test. Bottom: MFI in Trim28+/D9-heavy and -light animals across tissues. Two-sided Wilcoxon test. The lower and upper hinges of the boxplots correspond to the first and third quartiles. Boxplot hinges represent the first and third quartiles. Whiskers extend to 1.5 times the interquartile range. 22,964,279 nuclei analyzed from 38 male mice (intestine: 4 WT, 3 Trim28+/D9-light, 5 -heavy, 3 Tp53R270H/+, and 4 Tp53R270H/+;Trim28+/D9; lungs: 3 WT, 5 Trim28+/D9-light, 5 -heavy, 4 Tp53R270H/+, and 3 Tp53R270H/+;Trim28+/D9; pancreas: 4 WT, 4 Trim28+/D9-light, 5 -heavy, 4 Tp53R270H/+, and 4 Tp53R270H/+;Trim28+/D9; prostate: 3 WT, 3 Trim28+/D9-light, 4 -heavy, 3 Tp53R270H/+, and 3 Tp53R270H/+;Trim28+/D9; seminal vesicles: 3 WT, 5 Trim28+/D9-light, 4 -heavy, 4 Tp53R270H/+, and 3 Tp53R270H/+;Trim28+/D9). Panel b, top created with BioRender.com. Source data
Extended Data Fig. 4
Extended Data Fig. 4. Representative images of TRIM28 immunofluorescence in healthy tissues by genotype and in Trim28+/D9-heavy and -light animals.
Top: analyzed tissue: seminal vesicles, prostate, lungs, intestines, and pancreas. Left, from top to bottom: analyzed genotype: WT (light-grey), Trim28+/D9-heavy (dark-orange), Trim28+/D9-light (light-orange), Tp53R270H/+ (green), and Tp53R270H/+;Trim28+/D9 (purple). Representative images from one male mouse for each tissue.
Extended Data Fig. 5
Extended Data Fig. 5. Expression profiles of Trim28+/D9-light hypo-methylated genes in ear biopsies, healthy and tumor tissues.
In all boxplots, the lower and upper hinges represent the first and third quartiles. The whiskers extend to the smallest and largest values within 1.5*the interquartile range (IQR). The solid black dot indicates the mean. a-d) Genomic snapshots of genes enriched for differentially methylated probes between Trim28+/D9-light and heavy male mice. Black dotted boxes highlight differentially methylated regions, and significant probes are marked with asterisks. Boxplots show DNA methylation levels (beta values) for each gene. P-values are assessed by two-sided Wilcoxon test. N=24 male mice (15 -heavy, 9 -light). Genes shown: Mycn (a), Jak3 (b), Hmga2 (c), and the Pcdha cluster (d). e) Boxplot of mean expression for Trim28+/D9-light hypo-methylated genes in WT vs Trim28+/D9 animals from day 10 ear biopsies. P-value = 4.1e-7, two-sided Wilcoxon test. N=15 male mice (5 WT, Trim28+/D9). f) Boxplot of mean DNA methylation levels of Trim28+/D9-light hypo-methylated probes in WT vs Trim28+/D9 from day 10 ear clips. P-value < 2.2e-16, two-sided Wilcoxon test. N=22 male mice (8 WT, 14 Trim28+/D9). g) Paired dot plots showing mean expression of Trim28+/D9-light hypo-methylated genes in normal vs matched tumor samples across tissues. P-values: prostate (<2.2e-16), seminal vesicles (1.3e-6), intestine (3.2e-9), lungs (4.7e-4), two-sided Wilcoxon test. h) Heatmap of Trim28+/D9-light hypo-methylated genes in normal and matched tumor tissues, with Z-score transformation. In g-h, N=36 tissues (5 healthy and 5 matched tumor biological replicates for prostate, seminal vesicle, and intestine tumors, and 3 healthy and 3 matched lung tumor biological replicates, all from Trim28+/D9animals). i) Representative boxplots showing expression of Trim28+/D9-light hypo-methylated genes in tumor samples from Trim28+/D9-light and -heavy tissues. N=18 tissues (prostate: 3 -light, 2 -heavy animals; seminal vesicle: 3 -light, 2 -heavy; intestine: 2 -light, 3 -heavy; lungs: 1 -light, 2 -heavy). j) Heatmap showing number of mutations for indicated genes in tissues from Trim28+/D9-light and -heavy animals. Relative percentages of samples with mutations, and predicted effects, are reported alongside. Under the heatmap, bar plots show the percentage of mutated reads per sample. N=16 tissues (5 intestines, 2 lungs, 5 prostate, 4 seminal vesicles). Source data
Extended Data Fig. 6
Extended Data Fig. 6. Sex-specific effect of the Trim28+/D9-light hypo-methylated signature in human patients.
a) Volcano plot showing enrichment of metabolism-related gene sets (red) or other gene sets (grey) on Trim28+/D9-light hypo-methylated probes. The dotted line marks the False Discovery Rate (FDR) cut-off at 0.05. N=24 male mice (15 Trim28+/D9-heavy, 9 -light). b) Enrichment of genes with hypo-methylated probes in Trim28+/D9-light (light-orange) vs -heavy male animals (dark-orange) using the Jensen DISEASES database. P-value cut-off = 0.05, Fisher’s exact test. N=24 male mice (15 Trim28+/D9-heavy, 9 -light). c) Kaplan-Meier survival curves in male patients. Left: overall survival in months, showing significant difference between patients with mutations in Trim28+/D9-light hypo-methylated signature genes (light-orange, n=1660 samples) vs. non-mutated (black, n=3175 samples). Log-rank test, p=7.89e-8. Right: disease-free survival, comparing 687 mutated vs. 1478 non-mutated patients, same color-code as in the left panel. Log-rank test, p=2.41e-4. d) Kaplan-Meier survival curves in female patients. Left: overall survival comparing 1903 mutated samples (light-orange) vs. 3391 non-mutated samples (black). Log-rank test, p=1.57e-5. Right: disease-free survival, comparing 1125 mutated patients (light-orange) vs. 2023 non-mutated patients (black). Log-rank test, p=6.86e-6. e) Kaplan-Meier curve for overall survival of all TCGA Pan-Cancer patients with mutations in Trim28+/D9-heavy hypo-methylated genes (dark-orange, n=1865 samples) vs. non-mutated (black, n=9085 samples), showing no significant difference (p=0.375). Total cases = 10967 patients. f) Heatmap of disease-free survival impacts by mutations in specified genes and tumor types from TCGA/non-TCGA samples (N=69223 samples). Tumors are divided into two branches based on sample size (>3000, <3000). g-h) Heatmaps showing effects of gene expression on overall and disease-free survival in female (g) and male (h) patients, with a P-value cut-off = 0.05 from two-sided Pearson's correlations. Female: 5318 patients; Male: 4871 patients. Source data
Extended Data Fig. 7
Extended Data Fig. 7. Expression and DNA methylation of the Trim28+/D9-light hypo-methylated signature in human patients, and their effects.
a) Heatmap of the effects on overall survival probability of expression of the indicated genes and tumor types. P-value cut-off = 0.05, by linear regression analysis. N=10013 samples. b) Heatmap of the effects on disease-free survival probability of expression of the indicated genes and tumor types. P-value cut-off = 0.05, by linear regression analysis. N=10013 samples. c) Heatmap of the effects on overall survival probability of DNA methylation at Transcription Start Sites (TSS) of the indicated genes and tumor types. P-value cut-off = 0.01, by linear regression analysis. N=10013 samples. d) Heatmap of the effects on disease-free survival probability of DNA methylation at TSS of the indicated genes and tumor types. P-value cut-off = 0.01, by linear regression analysis. N=10013 samples. e) Heatmap showing the expression profile of Trim28+/D9-light signature genes, across tumor types from the TCGA Pan-Cancer Atlas. Primary tumors are separated from the available matching normal tissues. N=10013 samples. f) Heatmap showing DNA methylation profile at TSS of all Trim28+/D9-light signature genes, across tumor types from the TCGA Pan-Cancer Atlas. Primary tumors are separated from the available matching normal tissues. N=10013 samples. In all panels, the analyses include all samples from the TCGA Pan-Cancer Atlas with available RNA-seq and DNA methylation array data (N=10013 samples). TCGA Pan-Cancer Atlas legend: LAML=Acute Myeloid Leukemia; ACC=Adrenocortical carcinoma; BLCA=Bladder Urothelial Carcinoma; LGG=Brain Lower Grade Glioma; BRCA=Breast invasive carcinoma; CESC=Cervical squamous cell carcinoma and endocervical adenocarcinoma; CHOL=Cholangiocarcinoma; LCML=Chronic Myelogenous Leukemia; COAD=Colon adenocarcinoma; ESCA=Esophageal carcinoma; GBM=Glioblastoma multiforme; HNSC=Head and Neck squamous cell carcinoma; KICH=Kidney Chromophobe; KIRC=Kidney renal clear cell carcinoma; KIRP=Kidney renal papillary cell carcinoma; LIHC=Liver hepatocellular carcinoma; LUAD=Lung adenocarcinoma; LUSC=Lung squamous cell carcinoma; DLBC=Lymphoid Neoplasm Diffuse Large B-cell Lymphoma; MESO=Mesothelioma; MISC=Miscellaneous; OV=Ovarian serous cystadenocarcinoma; PAAD=Pancreatic adenocarcinoma; PCPG=Pheochromocytoma and Paraganglioma; PRAD=Prostate adenocarcinoma; READ=Rectum adenocarcinoma; SARC=Sarcoma; SKCM=Skin Cutaneous Melanoma; STAD=Stomach adenocarcinoma; TGCT=Testicular Germ Cell Tumors; THYM=Thymoma; THCA=Thyroid carcinoma; UCS=Uterine Carcinosarcoma; UCEC=Uterine Corpus Endometrial Carcinoma; UVM=Uveal Melanoma. Source data

Update of

References

    1. Greaves, M. & Maley, C. C. Clonal evolution in cancer. Nature481, 306–313 (2012). - PMC - PubMed
    1. Ganz, J. et al. Rates and patterns of clonal oncogenic mutations in the normal human brain. Cancer Discov.12, 172–185 (2022). - PMC - PubMed
    1. García-Nieto, P. E., Morrison, A. J. & Fraser, H. B. The somatic mutation landscape of the human body. Genome Biol.20, 298 (2019). - PMC - PubMed
    1. Lee-Six, H. et al. The landscape of somatic mutation in normal colorectal epithelial cells. Nature574, 532–537 (2019). - PubMed
    1. Martincorena, I. et al. High burden and pervasive positive selection of somatic mutations in normal human skin. Science348, 880–886 (2015). - PMC - PubMed

Substances