. 2025 Jan 24;22(1):18.
doi: 10.1186/s12974-025-03341-6.

Sex chromosomes and sex hormones differently shape microglial properties during normal physiological conditions in the adult mouse hippocampus

Affiliations

Sex chromosomes and sex hormones differently shape microglial properties during normal physiological conditions in the adult mouse hippocampus

Bianca Caroline Bobotis et al. J Neuroinflammation. .

Abstract

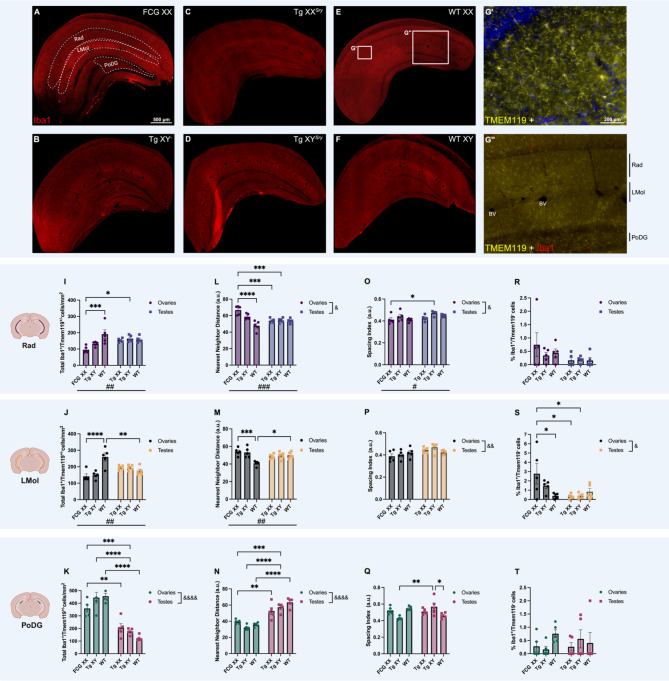
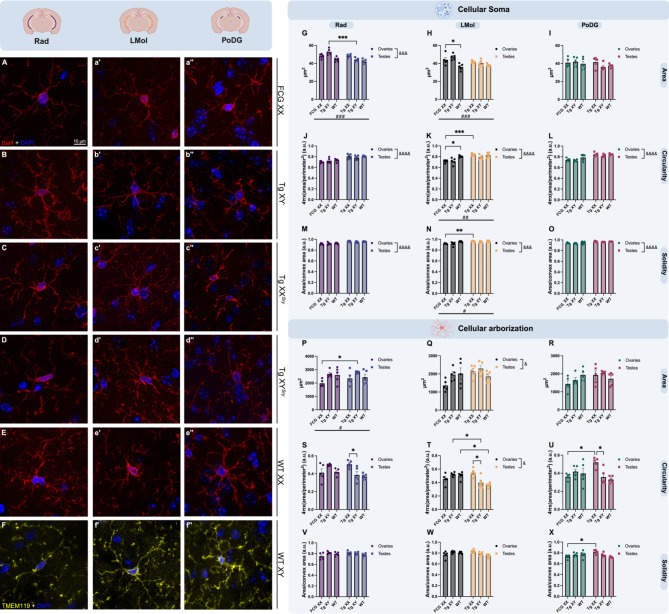
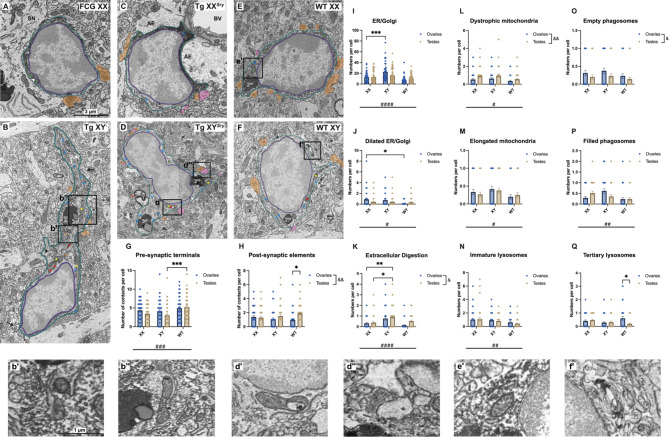
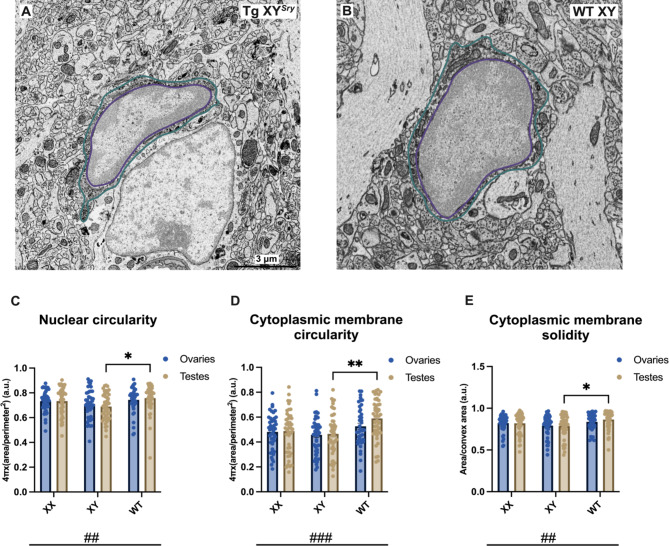
The brain presents various structural and functional sex differences, for which multiple factors are attributed: genetic, epigenetic, metabolic, and hormonal. While biological sex is determined by both sex chromosomes and sex hormones, little is known about how these two factors interact to establish this dimorphism. Sex differences in the brain also affect its resident immune cells, microglia, which actively survey the brain parenchyma and interact with sex hormones throughout life. However, microglial differences in density and distribution, morphology and ultrastructural patterns in physiological conditions during adulthood are largely unknown. Here, we investigated these aforementioned properties of microglia using the Four Core Genotypes (FCG) model, which allows for an independent assessment of gonadal hormones and sex chromosomal effects in four conditions: FCG XX and Tg XY- (both ovaries); Tg XXSry and Tg XYSry (both testes). We also compared the FCG results with XX and XY wild-type (WT) mice. In adult mice, we focused our investigation on the ventral hippocampus across different layers: CA1 stratum radiatum (Rad) and CA1 stratum lacunosum-moleculare (LMol), as well as the dentate gyrus polymorphic layer (PoDG). Double immunostaining for Iba1 and TMEM119 revealed that microglial density is influenced by both sex chromosomes and sex hormones. We show in the Rad and LMol that microglia are denser in FCG XX compared to Tg XYSry mice, however, microglia were densest in WT XX mice. In the PoDG, ovarian animals had increased microglial density compared to testes animals. Additionally, microglial morphology was modulated by a complex interaction between hormones and chromosomes, affecting both their cellular soma and arborization across the hippocampal layers. Moreover, ultrastructural analysis showed that microglia in WT animals make overall more contacts with pre- and post-synaptic elements than in FCG animals. Lastly, microglial markers of cellular stress, including mitochondrion elongation, and dilation of the endoplasmic reticulum and Golgi apparatus, were mostly chromosomally driven. Overall, we characterized different aspects of microglial properties during normal physiological conditions that were found to be shaped by sex chromosomes and sex hormones, shading more light onto how sex differences affect the brain immunity at steady-state.

Keywords: Density; Distribution; Four core genotypes; Hippocampus; Microglia; Morphology; Mouse; Scanning Electron Microscopy; Sex differences; Ultrastructure.


Conflict of interest statement

Declarations. Ethics approval: All animal experiments and procedures were approved by the Université Laval (2021-830 and 2023-1372) and the University of Victoria (AUP 2020-013) animal care committees, strictly following the recommendations from the Canadian Council on Animal Care. Consent for publication: Not applicable. Competing interests: The authors declare no competing interests.

Figures

Fig. 1
Fig. 1
Microglial density and distribution as well as peripheral cell infiltration are hormonally and chromosomally driven. Epifluorescence images of Iba1+ (in red) cells at 20x of magnification in the ventral hippocampus, illustrating the examined layers: CA1 stratum radiatum (Rad), CA1 stratum lacunosum-moleculare (LMol) and dentate gyrus polymorphic layer (PoDG). Panels A–F show representative images from FCG XX, Tg XY, Tg XXSry, Tg XYSry, WT XX, and WT XY genotypes, respectively. Panel G’ features a magnified area from panel E with zoomed-in TMEM119+/DAPI + cells (in yellow and blue). Panel G’’ highlights a magnified area from panel E, showing Iba1+/TMEM119+ colocalization (in red and yellow), along with a delineation of the hippocampal layers (Rad, LMol with a few blood vessels (BV) and PoDG). Panels I, J, and K display the total density of Iba1+/TMEM119+/− cells in the Rad, LMol and PoDG, respectively. Panels L, M, and N show the nearest neighbor distance results while panels O, P, and Q depict the spacing index findings. Panels R, S, and T represent the percentage of infiltration of Iba1+/TMEM119 cells. Main sex chromosomal effects are represented by hashtags (#) while main sex hormone effects are represented by ampersands (&). Data is expressed as mean ± S.E.M., with dots representing averaged values from a single mouse (n = 5 mice per group). Ordinary two-way ANOVA was used to assess the interaction between sex hormones (ovaries versus testes) and genotype (FCG XX versus FCG XY versus WT), followed by Tukey’s post-hoc tests for multiple comparisons in cases of significance. a.u.: arbitrary units *p < 0.05, **p < 0.01, ***p < 0.001 and ****p < 0.0001. Scale (A–F and magnifications): 500 μm and 200 μm. Created in BioRender
Fig. 2
Fig. 2
Microglial morphology is affected by a complex interaction between sex hormones and sex chromosomes. Confocal images of Iba1+/DAPI+ (in red and blue; A–e’’) or TMEM119+/DAPI+ (in yellow and blue; F–f’’) cells at 63x of magnification from the CA1 stratum radiatum (Rad; A–F), CA1 stratum lacunosum-moleculare (LMol; a’–f’) and dentate gyrus polymorphic layer (PoDG; a’’–f’’). Genotypes (FCG XX, Tg XY, Tg XXSry, Tg XYSry, WT XX and WT XY mice) are shown across the examined layers in A–a’’, B–b’’, C–c’’, D–d’’, E–e’’, F–f’’, respectively. Panels G, H, and I display the soma area; panels J, K, and L represent the soma circularity index and, panels M, N, and O present the cell soma solidity in the Rad, LMol and PoDG, respectively. Panels P, Q and R display the cellular arborization area; panels S, T and U show the cellular arborization circularity index and, panels V, W and X depict the arborization solidity results in the Rad, LMol and PoDG, respectively. Main sex chromosomal effects are represented by hashtags (#) while main sex hormone effects are represented by ampersands (&). Data is expressed as mean ± S.E.M., with dots representing averaged values from a single mouse (n = 15 cells in N = 5 mice per group). Ordinary two-way ANOVA was used to assess the interaction between sex hormones (ovaries versus testes) and genotype (FCG XX versus FCG XY versus WT), followed by Tukey’s post-hoc test for multiple comparisons. a.u.: arbitrary units *p < 0.05, **p < 0.01, ***p < 0.001 and ****p < 0.0001. Scale (A–f’’): 10 μm. Created in BioRender
Fig. 3
Fig. 3
Microglial ultrastructural markers of cellular stress are mostly chromosomally driven. Scanning electron microscopy images of microglial cell bodies featuring Iba1+ staining (A, B, C, and E) and non-stained microglial cell bodies (D and F) in the CA1 stratum radiatum (Rad). Genotypes (FCG XX, Tg XY, Tg XXSry, Tg XYSry, WT XX, and WT XY mice) are shown in panels A–F, respectively. Panels b’ and b’’ show a magnified view of the areas in B (dilated endoplasmic reticulum (ER)/Golgi apparatus and an elongated mitochondrion). Panels d’ and d’’ show a magnified view of the areas in D (elongated and dystrophic mitochondrion, and pre- and post-synaptic elements). Panel e’ shows a magnified view of the area in E (healthy mitochondria). Panel f’ shows a magnified view of the area in F (extracellular digestion). Panels G and H represent the contacts with pre- and post-synaptic elements, respectively. Panel I displays the numbers of ER/Golgi while panel J displays dilated ER/Golgi (> 100 nm) numbers. Panel K presents the number of extracellular digestion events. Panel L shows the numbers of dystrophic mitochondria and panel M the numbers of elongated mitochondria (> 1000 nm). Panel N shows the numbers of immature lysosomes (primary and secondary lysosomes summed). Panel O depicts the numbers of empty phagosomes and panel P the numbers of filled phagosomes per cell. Lastly, panel Q represents the numbers of tertiary lysosomes. Purple outline = nuclear membrane; turquoise outline = cytoplasmic membrane; green asterisk = healthy mitochondria; blue asterisk = ER/Golgi; orange asterisk = dilated ER/Golgi; yellow asterisk = elongated mitochondria; red asterisk = dystrophic mitochondria; black arrowhead = filled phagosome; white arrowhead = empty phagosome; black arrow = extracellular digestion area; red arrow = contact with a myelinated axon; orange pseudo-coloring = contact with a pre-synaptic terminal; pink pseudo-coloring = contact with a post-synaptic element; SN = satellite neuron; BV = blood vessel; AE = astrocytic-endfeet; 1st = primary lysosome; 2nd = secondary lysosome; 3rd = tertiary lysosome. Main sex chromosomal effects are represented by hashtags (#) while main sex hormone effects are represented by ampersands (&). Data is expressed as mean ± S.E.M., with dots representing absolute cell values (n = 10–12 cells in N = 4 mice per group). Ordinary two-way ANOVA was used to assess the interaction between sex hormones (ovaries versus testes) and genotype (FCG XX versus FCG XY versus WT), followed by Tukey’s post-hoc test for multiple comparisons. *p < 0.05, **p < 0.01, ***p < 0.001 and ****p < 0.0001. Scales (A–F and magnifications): 3 μm and 1 μm. Created in BioRender
Fig. 4
Fig. 4
Nuclear and cytoplasmic membrane circularity and solidity are sex chromosomally affected at the ultrastructural level. Scanning electron microscopy images of microglial cell bodies featuring positive Iba1 staining (A and B) in the CA1 stratum radiatum (Rad). Genotypes Tg XYSry and WT XY are shown in panels A and B, respectively. Panel C shows the nuclear circularity while panels D and E depict the cytoplasmic membrane circularity and solidity, respectively. Purple outline = nuclear membrane; turquoise outline = cytoplasmic membrane. Main sex chromosomal effects are represented by hashtags (#) while main sex hormone effects are represented by ampersands (&). Data is expressed as mean ± S.E.M., with dots representing absolute cell values (n = 10–12 cells in N = 4 mice per group). Ordinary two-way ANOVA was used to assess the interaction between sex hormones (ovaries versus testes) and genotype (FCG XX versus FCG XY versus WT), followed by Tukey’s post-hoc tests in cases of significance for multiple comparisons. *p < 0.05, **p < 0.01, ***p < 0.001 and ****p < 0.0001. Scale: 3 μm. Created in BioRender

References

    1. DeCasien AR, Guma E, Liu S, Raznahan A. Sex differences in the human brain: a roadmap for more careful analysis and interpretation of a biological reality. Biology Sex Differences. 2022;13:43. - PMC - PubMed
    1. Nojima T, Rings A, Allen AM, Otto N, Verschut TA, Billeter J-C, et al. A sex-specific switch between visual and olfactory inputs underlies adaptive sex differences in behavior. Curr Biol. 2021;31:1175–e11916. - PMC - PubMed
    1. Alfano V, Cavaliere C, Di Cecca A, Ciccarelli G, Salvatore M, Aiello M, et al. Sex differences in functional brain networks involved in interoception: an fMRI study. Front Neurosci. 2023;17:1130025. - PMC - PubMed
    1. Ratnu VS, Emami MR, Bredy TW. Genetic and epigenetic factors underlying sex differences in the regulation of gene expression in the brain. J Neurosci Res. 2017;95:301–10. - PMC - PubMed
    1. Weber CM, Clyne AM. Sex differences in the blood–brain barrier and neurodegenerative diseases. APL Bioeng. 2021;5:011509. - PMC - PubMed

Substances

LinkOut - more resources