. 2025 Jan 18;14(2):319.
doi: 10.3390/foods14020319.

Composite Flours Based on Black Lentil Seeds and Sprouts with Nutritional, Phytochemical and Rheological Impact on Bakery/Pastry Products

Affiliations

Composite Flours Based on Black Lentil Seeds and Sprouts with Nutritional, Phytochemical and Rheological Impact on Bakery/Pastry Products

Christine Neagu Dragomir et al. Foods. .

Abstract

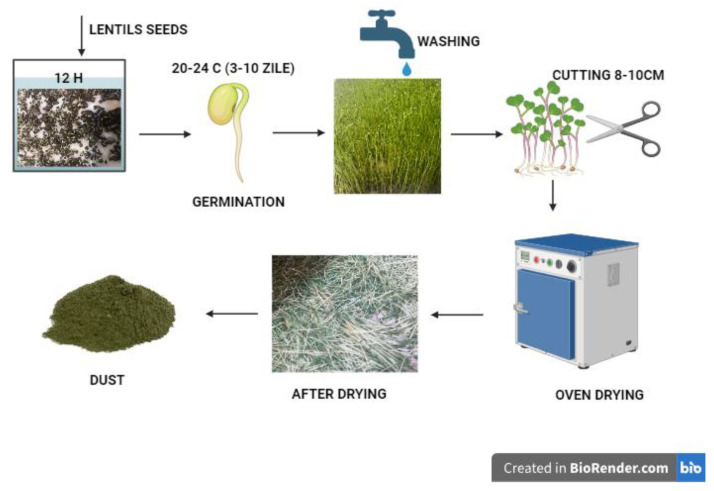
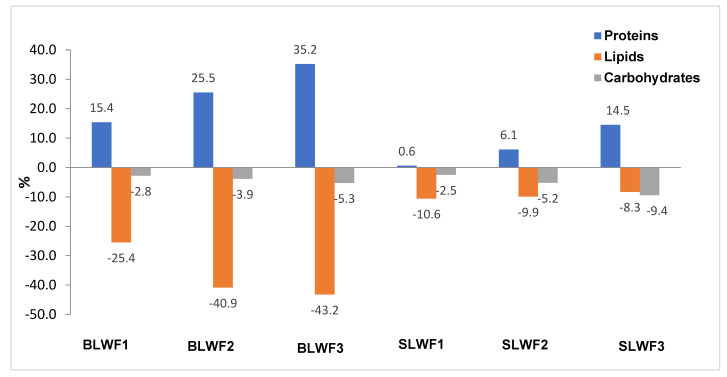
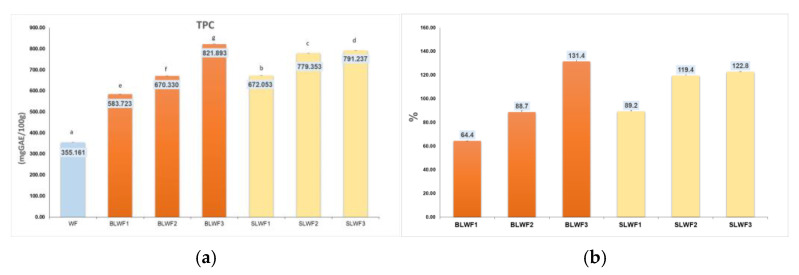
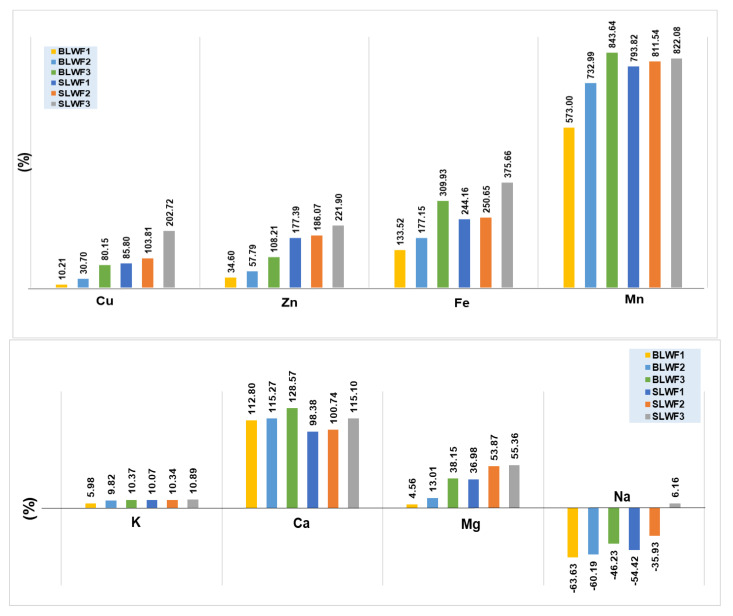
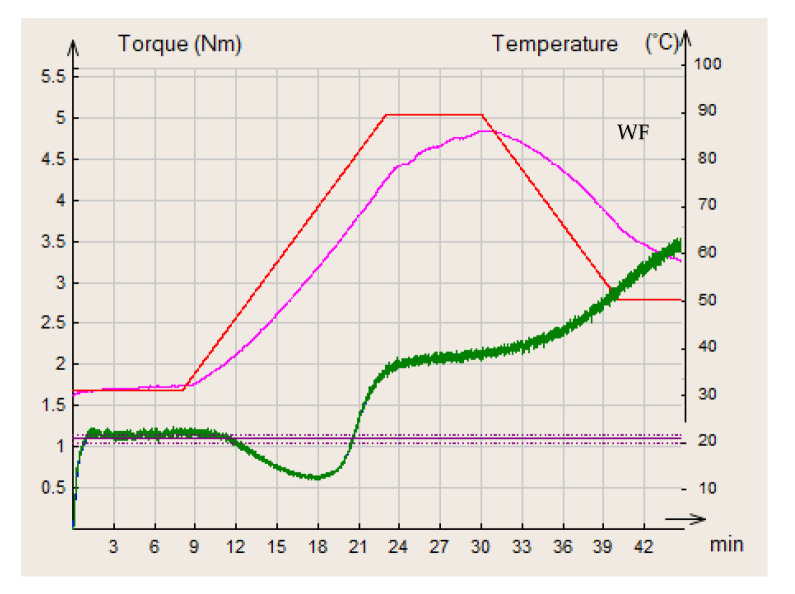
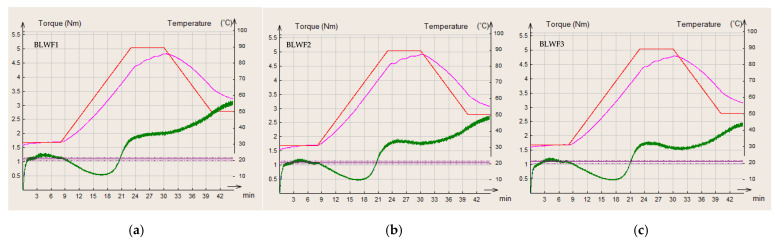
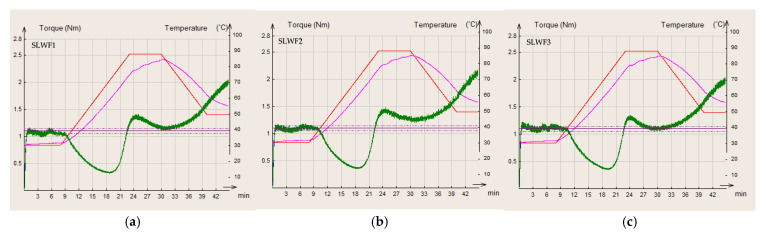
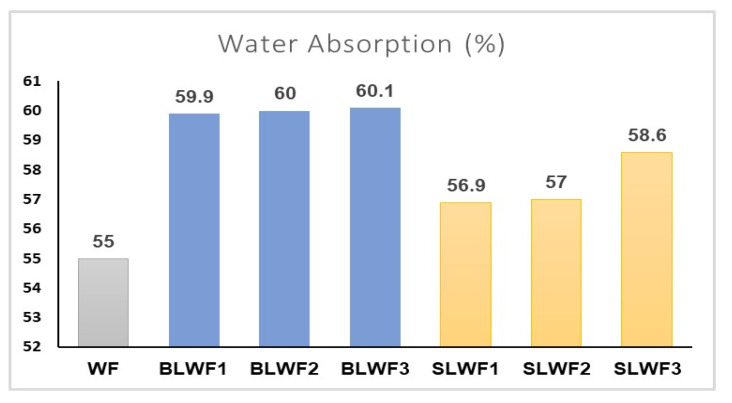
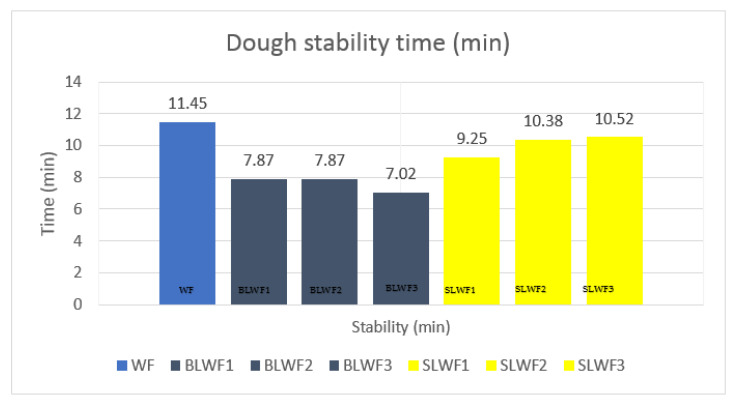
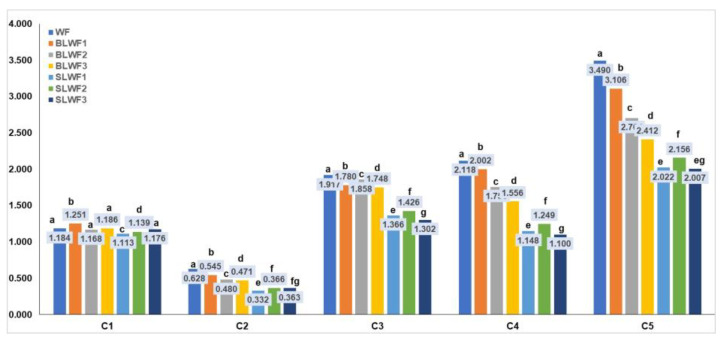
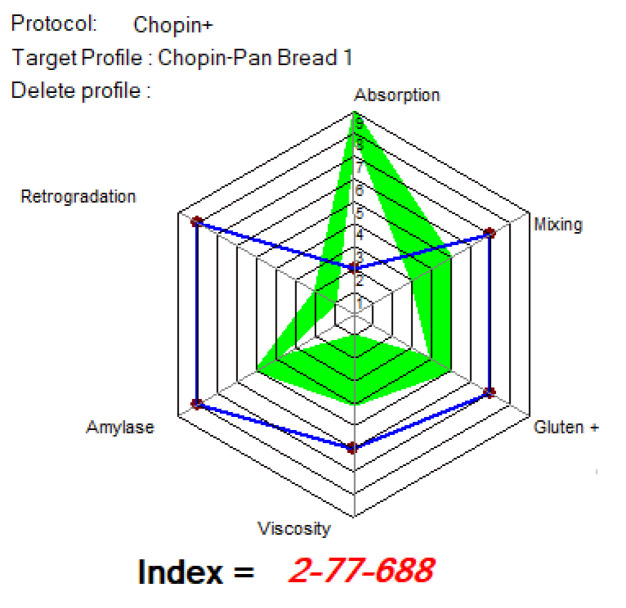
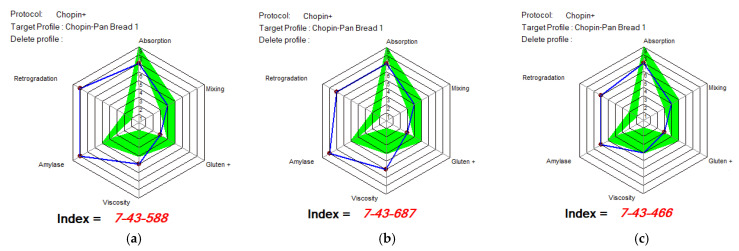
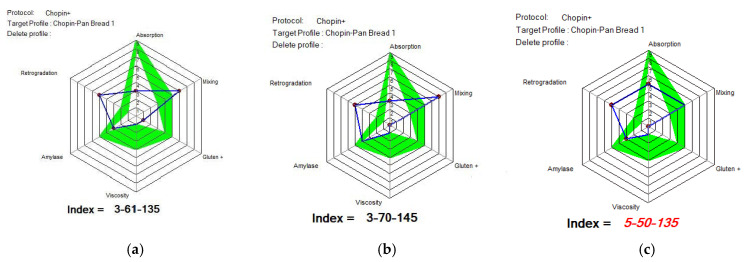
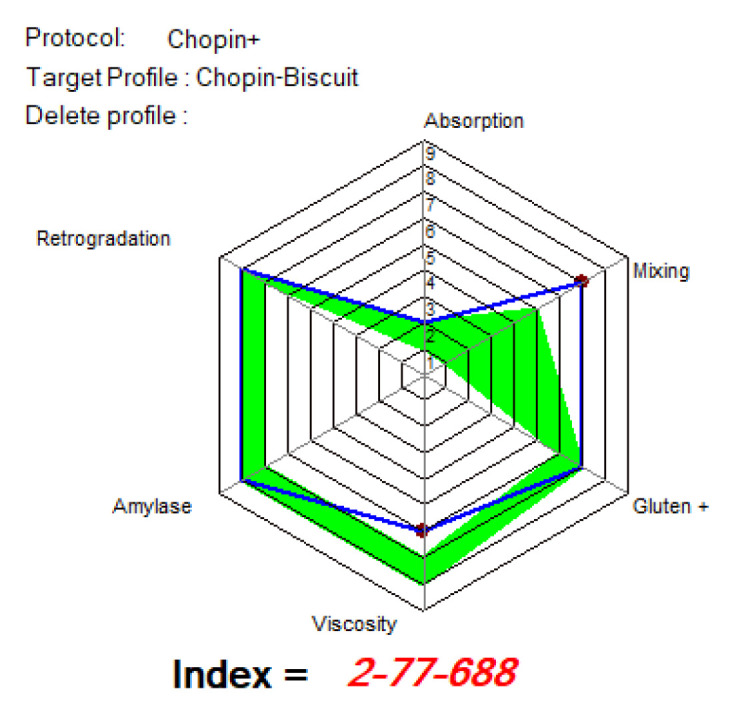
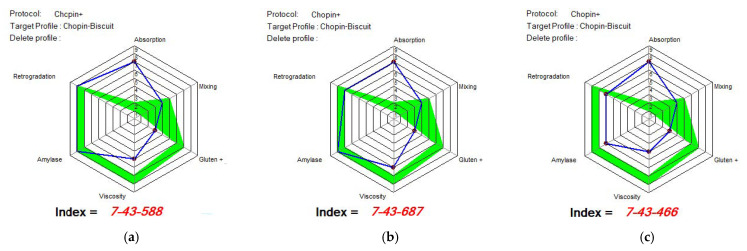
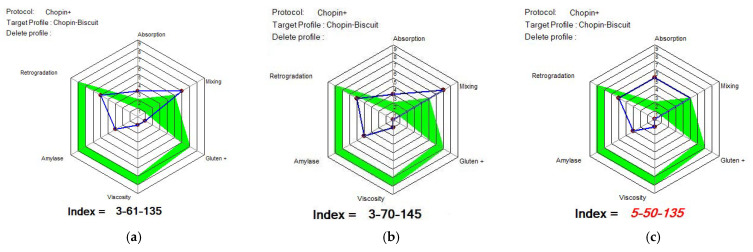
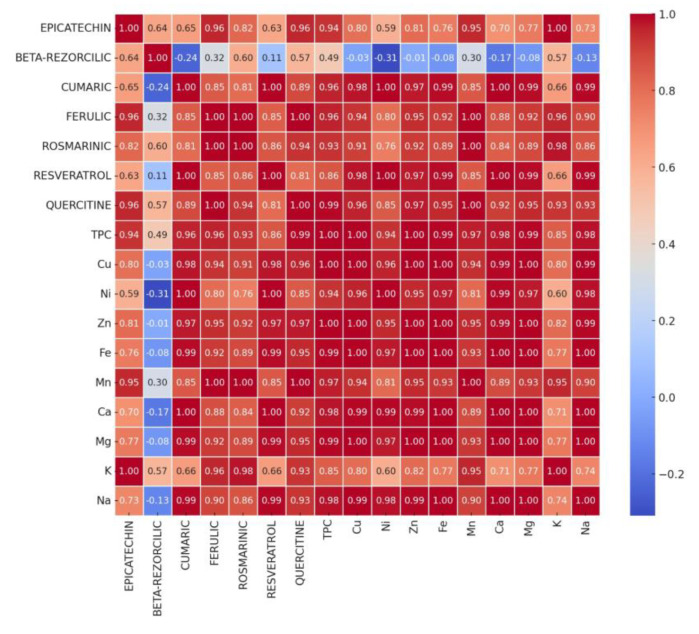
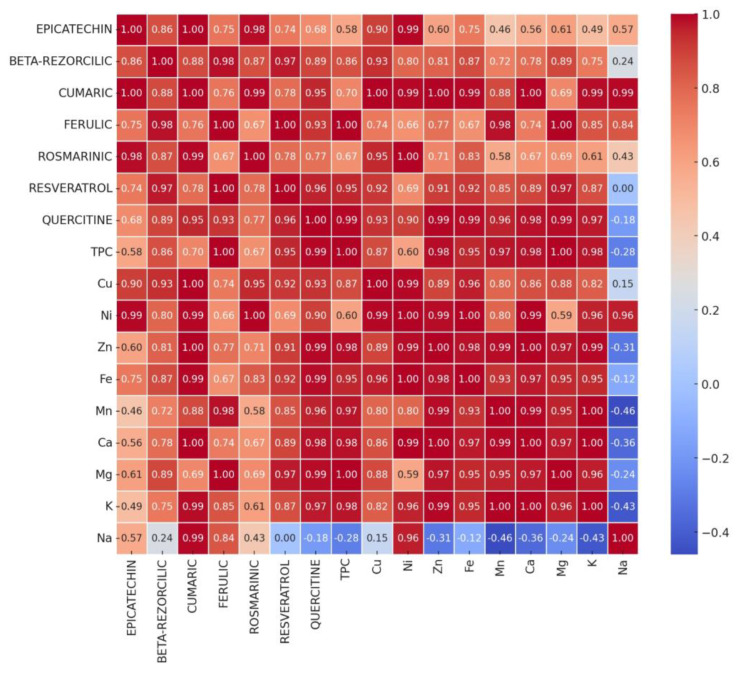
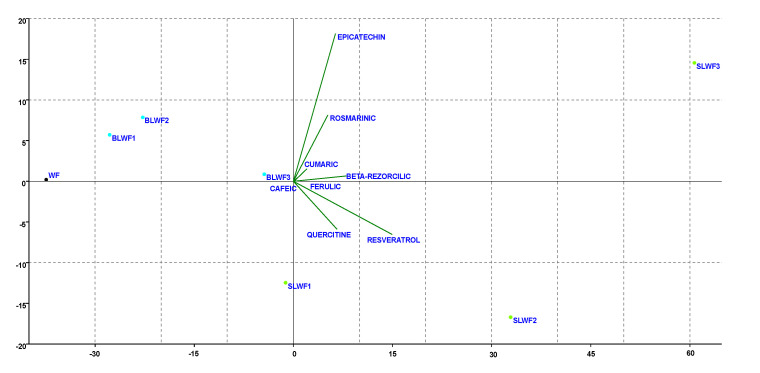
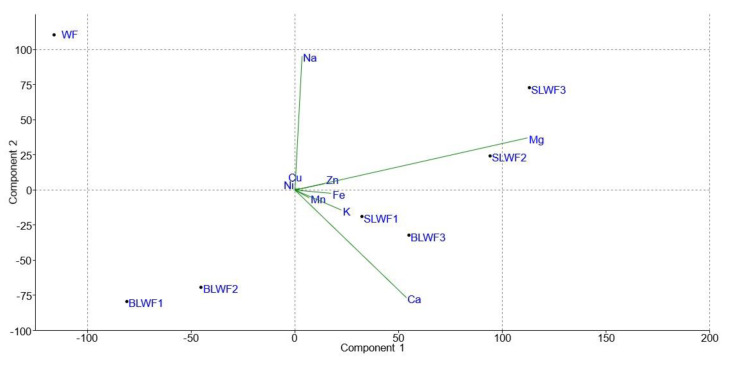
This paper aimed to study the nutritional, phytochemical and rheological properties of some composite flours based on wheat flour (WF) mixed with non-germinated (LF) and sprouted lentil flour (SLF), in order to fortify the wheat flour and to obtain functional bakery/pastry products. The composite flours based on wheat flour and bean lentil flour (BLWF) and sprouted lentil flour (SLWF) were analyzed from the point of view of proximate composition (proteins, lipids, total carbohydrates, and minerals), content of individual and total polyphenols (TPC), as well as the contents of macro and microelements. For use in baking/pastries, the composite flours were tested from the point of view of rheological behavior using the MIXOLAB system, and the profiles obtained were compared with those of bread and biscuit. The results indicated that fortifying wheat flour with lentil flour, both in non-germinated and sprouted forms, increased the protein by 0.6-35.2% and mineral content of the samples and decreased the lipids by 8.3-43.2% and the carbohydrates by 2.8-9.4%. The total polyphenol content (TPC) increased by fortifying the wheat flour with non-germinated and sprouted lentil flour, the increase being between 39.2-131.4%. Regarding individual polyphenols, nine polyphenols were determined, of which epicatechin (46.979 mg/kg) and quercetin (45.95 mg/kg) were identified in the highest concentration in the composite flours. The increase in micronutrient intake by fortifying wheat flour with black lentil flour in both germinated and ungerminated form is more significant compared to the increases recorded in the case of the main macronutrients (Ca, Na, Mg, and K). The micronutrients increased in the composite flours in the order: Cu < Zn < Fe < Mn. The MIXOLAB profile highlighted that black lentil flour, although having a higher absorption index than that recommended for biscuit production, would improve the stability of the dough.

Keywords: MIXOLAB; lentil; nutritional; phytochemical; sprout.


Conflict of interest statement

The authors declare no conflicts of interest.

Figures

Figure 1
Figure 1
Technological flow for obtaining black lentil sprouts. Figure created with BioRender.com, accessed on 5 December 2024.
Figure 2
Figure 2
The composite flours: BLWF composite flours obtained by mixture of WF + LF; SLWF composite flours obtained by mixture of WF + SLF. Figure created with BioRender.com, accessed on 5 December 2024.
Figure 3
Figure 3
The increase/decrease of nutritional parmaeters in composite flours compared with wheat flour type 650. WF-wheat flour, BLWF1–3-composite wheat–lentil flours, SLWF1–3-composite wheat–lentil sprouts flours.
Figure 4
Figure 4
(a) TPC (mg GAE/100 g) of composite flours; (b) the increase in TPC content (%) of composite flours compared with wheat flour type 650. WF-wheat flour, BLWF1–3-composite wheat–lentil flours, SLWF1–3-composite wheat–lentil sprouts flours. The values are expressed as mean values ± standard deviations of all measurements; data within columns sharing different superscripts are significantly different (p < 0.05); data within the columns sharing the same superscripts are not significantly different (p > 0.05).
Figure 5
Figure 5
The increase/decrease of macro and microelements in composite flours compared with wheat flour type 650. WF-wheat flour, BLWF1–3-composite wheat–lentil flours, SLWF1–3-composite wheat–lentil sprouts flours.
Figure 6
Figure 6
MIXOLAB rheological profiles of the analyzed sample with 100% wheat flour (WF). Red line—MIXOLAB temperature (°C), pink line—dough temperature (°C), green line—MIXOLAB curve.
Figure 7
Figure 7
MIXOLAB rheological profiles of the composite flours with different proportions of black lentils flour and wheat flour type 650: (a) BLWF 1, (b) BLWF2, (c) BLWF3. red line—MIXOLAB temperature (°C), pink line—dough temperature (°C), green line—MIXOLAB curve.
Figure 8
Figure 8
MIXOLAB rheological profiles of the composite flours with different proportions of black lentil sprouts flour and wheat flour type 650: (a) SLWF 1, (b) SLWF2, (c) SLWF3. red line—MIXOLAB temperature (°C), pink line—dough temperature (°C), green line—MIXOLAB curve.
Figure 9
Figure 9
Water absorption (%) of composite flours determined using MIXOLAB system. WF-wheat flour, BLWF1–3-composite wheat–lentil flours, SLWF1–3-composite wheat–lentil sprouts flours.
Figure 10
Figure 10
Dough stability time (minutes) of composite flours determined using MIXOLAB system. WF-wheat flour, BLWF1–3-composite wheat–lentil flours, SLWF1–3-composite wheat–lentil sprouts flours.
Figure 11
Figure 11
Torque indices (Nm) for composite flours (BLWF, SLWF) and wheat flour type 650 (WF). C1: maximum torque during mixing; C2: torque reflecting protein weakening caused by mechanical stress and increasing temperature; C3: torque reflecting rate of starch gelatinization; C4: minimum torque during heating; C5: torque after cooling to 50 °C. WF-wheat flour, BLWF1–3-composite wheat–lentil flours, SLWF1–3-composite wheat–lentil sprouts flours. The values are expressed as mean values ± standard deviations of all measurements; data within the each group columns sharing different superscripts are significantly different (p < 0.05); data within the each group columns sharing the same superscripts are not significantly different (p > 0.05). * nd—not detectable.
Figure 12
Figure 12
MIXOLAB Profiler index of the analyzed sample with 100% wheat flour (WF) for bread technology.
Figure 13
Figure 13
MIXOLAB Profiler index of composite flours with different proportions of black lentil flour (BLWF) and wheat flour type 650 (WF) for bread technology. (a) BLWF 1, (b) BLWF2, (c) BLWF3. Blue line represents the profile of composite flours and green line represents the profile of optimal MIXOLAB parameters for bread technology.
Figure 14
Figure 14
MIXOLAB Profiler index of the composite flours with different proportions of black lentil sprouts flour (SLWF) and wheat flour type 650 (WF) for bread technology. (a) SLWF 1, (b) SLWF2, (c) SLWF3. Blue line represents the profile of composite flours and green line represents the profile of optimal MIXOLAB parameters for bread technology.
Figure 15
Figure 15
MIXOLAB Profiler index of the analyzed sample with 100% wheat flour (WF) for biscuits technology. Blue line represents the profile of composite flours and green line represents the profile of optimal MIXOLAB parameters for bread technology.
Figure 16
Figure 16
MIXOLAB Profiler index of the composite flours with different proportions of black lentil sprouts flour and wheat flour type 650 for biscuits technology. (a) BLWF 1, (b) BLWF2, (c) BLWF3. Blue line represents the profile of composite flours and green line represents the profile of optimal MIXOLAB parameters for bread technology.
Figure 17
Figure 17
MIXOLAB Profiler index of the composite flours with different proportions of black lentil sprouts flour and wheat flour type 650 for biscuits technology. (a) SLWF 1, (b) SLWF2, (c) SLWF3. Blue line represents the profile of composite flours and green line represents the profile of optimal MIXOLAB parameters for bread technology.
Figure 18
Figure 18
Pearson correlation between individual polyphenol contents and macro and microelement contents for composite flours BLWF1, BLWF2, and BLWF3.
Figure 19
Figure 19
Pearson correlation between individual polyphenol contents and macro and microelement contents for composite flours SLWF1, SLWF2, and SLWF3.
Figure 20
Figure 20
Projection of the parameters (individual polyphenols) of composite flours (BLWF and SLWF) by the first and second principal components.
Figure 21
Figure 21
Projection of the parameters (macro and microelements) of composite flours (BLWF and SLWF) by the first and second principal components.

Similar articles

References

    1. López-Amorós M., Hernández T., Estrella I. Effect of germination on legume phenolic compounds and their antioxidant activity. J. Food Compos. Anal. 2006;19:277–283. doi: 10.1016/j.jfca.2004.06.012. - DOI
    1. Kumar S., Barpete S., Kumar J., Gupta P., Sarker A. Global lentil production: Constraints and strategies. SATSA Mukhapatra-Annu. Tech. 2013;17:1–13.
    1. Jenkins J.M. The impact of solar-like variability on the detectability of transiting terrestrial planets. Astrophys. J. 2002;575:493. doi: 10.1086/341136. - DOI
    1. Roberfroid M. Prebiotics: The concept revisited1. J. Nutr. 2007;137:830S–837S. doi: 10.1093/jn/137.3.830S. - DOI - PubMed
    1. Xu B., Chang S.K. Phenolic substance characterization and chemical and cell-based antioxidant activities of 11 lentils grown in the Northern United States. J. Agric. Food Chem. 2010;58:1509–1517. doi: 10.1021/jf903532y. - DOI - PubMed

LinkOut - more resources