Review
. 2025 Jan 14;15(2):183.
doi: 10.3390/diagnostics15020183.

A Narrative Review of Biomarkers and Imaging in the Diagnosis of Acute Aortic Syndrome

Affiliations
Review

A Narrative Review of Biomarkers and Imaging in the Diagnosis of Acute Aortic Syndrome

Ümit Arslan et al. Diagnostics (Basel). .

Abstract

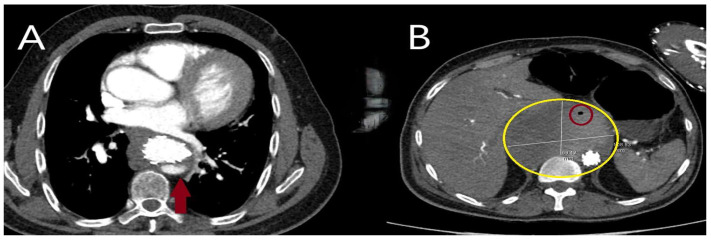
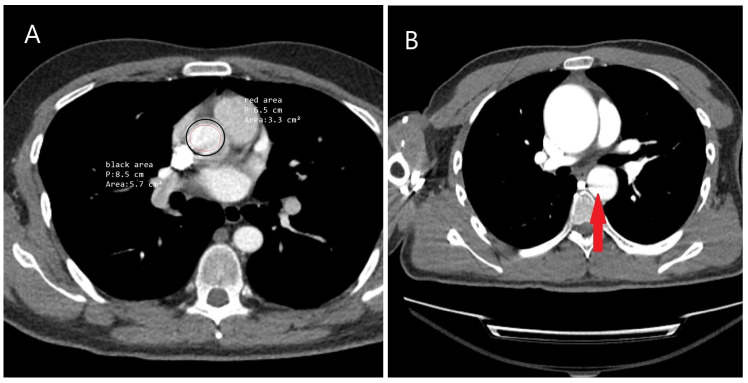
Acute aortic syndrome (AAS) encompasses a range of life-threatening conditions, including classical dissection, intramural hematoma, and penetrating aortic ulcer. Each of these conditions presents distinct clinical characteristics and carries the potential to progress to rupture. Because AAS can be asymptomatic or present with diverse symptoms, its diagnosis requires clinical evaluation, risk scoring, and biomarkers such as D-dimer (DD), C-reactive protein (CRP), homocysteine, natriuretic peptides (BNP), and imaging modalities like computed tomography (CT), magnetic resonance imaging (MRI), and echocardiography. While this review primarily focuses on widely used and clinically accessible biomarkers and imaging techniques, it also discusses alternative biomarkers proposed for diagnostic use. Although CT remains the gold standard for diagnosis, biomarkers facilitate rapid risk stratification, complementing imaging techniques. Emerging technologies, such as metabolomics, are reshaping diagnostic algorithms. Despite advances in diagnostic methods, challenges such as misdiagnosis and missed diagnoses persist. Ongoing research into novel biomarkers and innovative imaging techniques holds promise for improving diagnostic accuracy and patient outcomes.

Keywords: D-dimer; acute aortic syndrome; aortic dissection; artificial intelligence; biomarkers; computed tomography.


Conflict of interest statement

The authors declare no conflicts of interest.

Figures

Figure 1
Figure 1
Operative and computed tomography angiography images illustrating traumatic aortic injury. (A) A 45-year-old male patient involved in a motor vehicle accident with chest impact against the steering wheel underwent surgery due to massive pericardial effusion detected on echocardiography. The rupture site was located on the right lateral wall of the ascending aorta (black box). (B) A 9-year-old male patient who fell from a walnut tree was found to have a transection just distal to the subclavian artery on computed tomography angiography performed in the emergency department. The injury was treated with a stent graft. (C) A 35-year-old male farmer was treated for descending aortic dissection following a tractor rollover accident. (D) A 63-year-old female patient was treated for descending aortic dissection resulting from a motor vehicle accident outside the vehicle (The yellow arrows indicate the location of the dissection).
Figure 2
Figure 2
Computed tomography and operative images demonstrating iatrogenic aortic injury. (A,B) Axial (asterisk) and sagittal (yellow arrow) CT images showing dissection in the right anterolateral segment of the ascending aorta, which developed during imaging of the right coronary artery in a 50-year-old male patient with inferior myocardial infarction. (C) Angiographic image showing a hematoma in the right lateral wall of the ascending aorta (black arrow) that developed during angiography in a 60-year-old male patient. (D) CT image showing a hematoma and dissection at the aortic cannulation site (indicated by the ampersand symbol) in a 45-year-old female patient who had undergone surgery for bicuspid aortic valve one month prior to the dissection event.
Figure 3
Figure 3
CT and operative images illustrating true lumen (TL) and false lumen (FL) in classic aortic dissection. (A,B) Images from a 48-year-old male long-haul truck driver with no known risk factors other than smoking. He was diagnosed with type A aortic dissection following severe, tearing chest pain triggered by emotional stress. In (B), the aspirator demonstrates the false lumen (FL). (C,D) Images from a 65-year-old female patient with diabetes mellitus and hypertension who was diagnosed with aortic dissection in the emergency department four days after persistent back pain radiating distally from between the scapulae. The pincette highlights the intimomedial flap, and the FL shows a thrombotic appearance (TL = true lumen; FL = false lumen).
Figure 4
Figure 4
Schematic representation of the TEM classification (descriptions are provided in Table 1). Derived from the 2024 ESC Guidelines [6].
Figure 5
Figure 5
CT and operative images of incomplete dissection. A 28-year-old male farmer with a marfanoid physical appearance but no notable family history was evaluated for exertional dyspnea and diagnosed with severe aortic insufficiency. (A) Coronal CT image showing an ascending aortic aneurysm. (B) Operative image of the ascending aorta. Pay attention to the absence of findings indicative of aortic dissection in both the CT and operative images. (C) During exploration of the ascending aorta, which appeared solely as an aneurysm on imaging, a pocket-like, self-contained dissected area was identified (black arrow). Genetic testing for the patient is ongoing.
Figure 6
Figure 6
CT images of intramural hematoma and periaortitis. (A) Axial CT image of a 68-year-old patient with a history of hypertension, smoking, and coronary artery bypass grafting. The site of the intimal defect is visible (blue arrow), and intimal calcifications (typically associated with atherosclerotic risk factors) are distinguishable features (red star). (B) CT image of a 77-year-old male patient diagnosed with type B intramural hematoma detected during routine scans (green arrow) while undergoing treatment for chronic obstructive pulmonary disease. (C) CT image of a 58-year-old male patient who presented with intermittent low-grade fever and accompanying chest pain during the day. Echocardiography revealed thickening of the ascending aortic wall and an increase in diameter, prompting further evaluation with CT. The scan identified circular, non-luminal periaortic findings consistent with periaortitis. This condition, often associated with diseases such as Erdheim–Chester disease or IgG4-related vasculitis, requires further investigation to avoid misdiagnosis as intramural hematoma (red arrow).
Figure 7
Figure 7
CT images of penetrating aortic ulcer (PAU). (A) CT image of a 72-year-old male patient undergoing coronary CT angiography, revealing an incidental finding of atheromatous plaque disruption with a penetrating ulcer extending into the intima within the aortic arch. (B) Sagittal CT image of the same patient, providing a clearer view of the aortic ulcer. This highlights the importance of evaluating axial images alongside other CT slices for accurate assessment. (C,D) CT images of a 65-year-old female patient with a history of cancer treatment, hyperlipidemia, hypothyroidism, and smoking. The scans, performed due to back pain, incidentally revealed a penetrating aortic ulcer. Yellow arrows indicate the PAU.
Figure 8
Figure 8
CT, TEE, and operative images of hereditary thoracic aortic aneurysm. A 58-year-old asymptomatic male patient, evaluated for screening purposes due to his brother’s history of aortic dissection, was incidentally found to have a giant ascending aortic aneurysm. (A) Axial CT image showing the aneurysm measuring 8.6 cm.; A, Ascending aorta (8.6 cm) (B) TEE performed to assess aortic valve pathology revealed a tricuspid valve with severe aortic insufficiency, and the ascending aorta measured 8.4 cm. (C) 3D CT angiography evaluating all segments of the aorta to investigate the presence of additional aneurysms. (D) Intraoperative image showing the ascending aorta expanding circularly to occupy the entire mediastinum and displacing the heart to the left (yellow star). The patient underwent a Bentall procedure, and ventricular functions improved postoperatively.
Figure 9
Figure 9
CT, aortography, and operative images of a patient with a bicuspid aortic valve causing an ascending aortic aneurysm. A 55-year-old male patient was under follow-up for known bicuspid aortic valve disease. Despite initially refusing surgery due to fear of the procedure, he decided to undergo surgery due to worsening dyspnea and decreased functional capacity in recent months. (A) Axial CT image showing the ascending aorta measuring over 50 mm. (B) Aortography confirming the diameter of the ascending aorta exceeds 50 mm. (C) Operative image showing the post-stenotic aneurysm with an enlarged aorta (in cases of root aneurysms or bulb-like aortic shapes, bicuspid aortic valve should always be investigated). (D) Intraoperative image demonstrating the calcified and fused cusps of the bicuspid aortic valve.
Figure 10
Figure 10
CT, MR, and angiographic imaging of Takayasu arteritis and giant cell arteritis. (A) A 28-year-old female patient presenting with symptoms of arm numbness and weakness during activity was initially evaluated for thoracic outlet syndrome and cervical discopathy. However, MR imaging revealed findings consistent with Takayasu arteritis, demonstrating long-segment caliber loss in the left subclavian and carotid arteries (red arrow; TB, Truncus Brachiocephalicus). (B) A 32-year-old male smoker presented with ischemia in the left upper extremity. Clinical history revealed frequent episodes of amaurosis fugax. Doppler ultrasonography of the carotid and upper extremities showed no detectable flow, and angiography confirmed occlusion (red star). The patient was diagnosed with Takayasu arteritis following a temporal artery biopsy. (C) A 62-year-old female patient from the Caucasus with a recent history of worsening headaches, dizziness triggered by sudden movements, persistent tinnitus, and mildly elevated D-dimer levels was initially suspected to have long COVID syndrome. However, Doppler ultrasound and subsequent CT imaging revealed fibrotic thickening of the arterial walls in both carotid arteries, with significant stenosis in the right carotid artery (yellow arrows). Temporal artery biopsy confirmed a diagnosis of giant cell arteritis.
Figure 11
Figure 11
CT and surgical images of aortitis associated with immune-mediated inflammatory diseases. (A) A 58-year-old male farmer presented with weight loss and claudication. CT imaging revealed circular fibrotic tissue surrounding the abdominal aorta (black square) along with retroperitoneal fibrosis, leading to a diagnosis of Erdheim–Chester disease. (B) A 3D CT angiography of the same patient showed the aorta appearing normal, resembling that of a healthy individual (yellow arrow). These images emphasize the need for meticulous examination of CT findings, especially when evaluating aneurysms and intramural hematomas. (C) A 25-year-old male patient presented with recurrent pain in the lower right abdominal quadrant. He reported a history of frequent oral ulcers and occasional vision problems, suggestive of Behçet’s disease. Despite ongoing medication, the patient experienced persistent attacks. During his third-year follow-up, he was evaluated for claudication and was found to have a saccular aneurysm in the abdominal aorta (black arrow) and a diminutive right iliac artery (red arrow). (D) A 22-year-old male heavy smoker underwent early coronary artery bypass grafting due to acute coronary syndrome caused by a left main coronary lesion. Intraoperatively, the ascending aorta appeared small relative to his body size, irregularly shaped, and covered with a marble-white fibrous tissue. Biopsy findings confirmed a diagnosis of IgG4-related aortitis. He is currently under follow-up by the rheumatology clinic.
Figure 12
Figure 12
Vascular complications of aortic dissection. (A) CT image of a 52-year-old female patient who presented to the emergency department with tearing chest pain. Electrocardiography revealed findings consistent with inferior myocardial infarction, but elevated D-dimer and C-reactive protein levels prompted further evaluation with CT, leading to a diagnosis of aortic dissection. The dissection flap was found to originate from the right coronary artery ostium (yellow arrow). Additionally, 1.43 cm of pericardial effusion due to the dissection was observed. (B) CT image of a 62-year-old male patient presenting with findings of inferior myocardial infarction. Point-of-care echocardiography in the emergency department raised suspicion of an intimal flap. Further evaluation revealed that the type A aortic dissection also dissected the right coronary artery (black star). (C,D) CT images of a 65-year-old male patient on antihypertensive medication who presented to the emergency department after experiencing syncope following upper extremity numbness. The dissection was found to extend along the brachiocephalic trunk (green arrow) and carotid arteries (white arrows).
Figure 13
Figure 13
X-ray images associated with aortic diseases. (A) X-ray image of a 25-year-old male patient with Marfan syndrome, showing a long and narrow thoracic cage and downward-appearing heart. Spinal curvature is also observed. (B) X-ray image of a 62-year-old male patient showing projections in the mediastinum corresponding to the ascending aorta. The yellow arrow indicates the aortic knob, while the green arrow highlights the prominence of rightward enlargement. (C) X-ray image of a 75-year-old male patient showing a prominent aortic knob (yellow arrow). Further evaluation of these suspicious findings is recommended.
Figure 14
Figure 14
Echocardiographic images in acute aortic dissection. (A) CT image of a 52-year-old female patient evaluated in the emergency department, leading to the diagnosis of type A aortic dissection. (B) Point-of-care transthoracic parasternal long-axis echocardiography showing the intimal flap (red arrow), performed to assess the condition of the aortic valve. (C) Three-dimensional transesophageal echocardiography (TEE) image obtained after anesthesia induction, demonstrating the true lumen (TL) and false lumen (FL). Performing TEE for every patient undergoing surgery provides critical insights for valve repair planning (LA, left atrium; LV, left ventricle).
Figure 15
Figure 15
The role of CT in the evaluation of the aorta for treatment planning. A 52-year-old male of Caucasian descent was diagnosed with an aortic arch aneurysm after a vigilant gastroenterologist detected pulsations in the esophageal wall during endoscopy, performed to investigate the etiology of dysphagia. (A) Axial CT image showing the aneurysm in the aortic arch. (B) Translucent 3D CT image highlighting the aneurysm in the aortic arch (yellow arrow). (C) Based on the CT findings, the patient underwent a debranching operation with a bifurcated graft and simultaneous thoracic endovascular aneurysm repair (TEVAR). (D) Follow-up CT one year later revealed the development of an aneurysm and dissection at the graft anastomosis site in the ascending aorta (black star).
Figure 16
Figure 16
The use of CT in identifying rupture. (A) CT image of a 57-year-old female patient with a history of hypertension who presented to the emergency department with paraplegia and sudden-onset dyspnea. Hypotension prompted further evaluation with CT, which revealed a type B aortic dissection rupture into the left thoracic cavity. The yellow arrow indicates the “Yin-Yang phenomenon” within the descending aorta, suggesting continued flow in the false lumen. The patient was treated with emergency TEVAR under spinal cord pressure-reducing therapy; however, the paraplegia remained permanent. (B) CT image of an 80-year-old male patient diagnosed with type B acute aortic dissection, which led to hypotensive shock and rupture into the left thoracic cavity. * Red asterisk indicates pleural effusion.
Figure 17
Figure 17
The use of CT in detecting stent and stent-related complications. (A) CT image of a 75-year-old male patient with chronic obstructive pulmonary disease (COPD), showing an endoleak into the aneurysm during follow-up of the TEVAR stent (red arrow). (B) CT image of a 50-year-old male patient with achondroplasia undergoing stent follow-up for a thoracic aortic aneurysm. The area within the yellow circle indicates the aneurysm, while the red circle highlights the presence of air within the aneurysm. If air bubbles increase during follow-up, stent or aneurysm infection should be considered.
Figure 18
Figure 18
The significance of artifacts in CT imaging. (A) CT image of a 48-year-old male patient obtained to evaluate ascending aortic dilatation detected on echocardiography. The classic CT scan failed to clearly define the aortic diameter, with a discrepancy observed between the area within the red circle and the area within the black circle. Measurement using ECG-gated CT revealed an ascending aortic diameter of 48 mm. The difference in aortic diameters during systole and diastole caused this artifact. (B) CT image of a 30-year-old male patient with Marfan syndrome, showing a motion artifact in the descending aorta (red arrow), which is significant as it may mimic suspicion of dissection.

Similar articles

Cited by

References

    1. Suzuki Y., DeAnda A., Jr. Revisiting the Death and Autopsy of King George II. Aorta. 2021;9:196–198. doi: 10.1055/s-0041-1729915. - DOI - PMC - PubMed
    1. Vilacosta I., Aragoncillo P., Cañadas Román S., Ferreirós J.A., Rodríguez J. Acute aortic syndrome: A new look at an old conundrum. Postgrad. Med. J. 2010;86:52–61. doi: 10.1136/hrt.2008.153650. - DOI - PubMed
    1. Baliyan V., Parakh A., Prabhakar A.M., Hedgire S. Acute aortic syndromes and aortic emergencies. Cardiovasc. Diagn. Ther. 2018;8:S82–S96. doi: 10.21037/cdt.2018.03.02. - DOI - PMC - PubMed
    1. Vilacosta I., San Román J.A., Di Bartolomeo R., Eagle K., Estrera A.L., Ferrera C., Kaji S., Nienaber C.A., Riambau V., Schäfers H.J., et al. Acute aortic syndrome revisited: JACC state-of-the-art review. J. Am. Coll. Cardiol. 2021;78:2106–2125. doi: 10.1016/j.jacc.2021.09.022. - DOI - PubMed
    1. Ciccone M.M., Dentamaro I., Masi F., Carbonara S., Ricci G. Advances in the diagnosis of acute aortic syndromes: Role of imaging techniques. Vasc. Med. 2016;21:239–250. doi: 10.1177/1358863X16631419. - DOI - PubMed

LinkOut - more resources