. 2025 Jan 13;14(1):63.
doi: 10.3390/biology14010063.

GRAMMAR-Lambda Delivers Efficient Understanding of the Genetic Basis for Head Size in Catfish

Affiliations

GRAMMAR-Lambda Delivers Efficient Understanding of the Genetic Basis for Head Size in Catfish

Yunfeng Zhao et al. Biology (Basel). .

Abstract

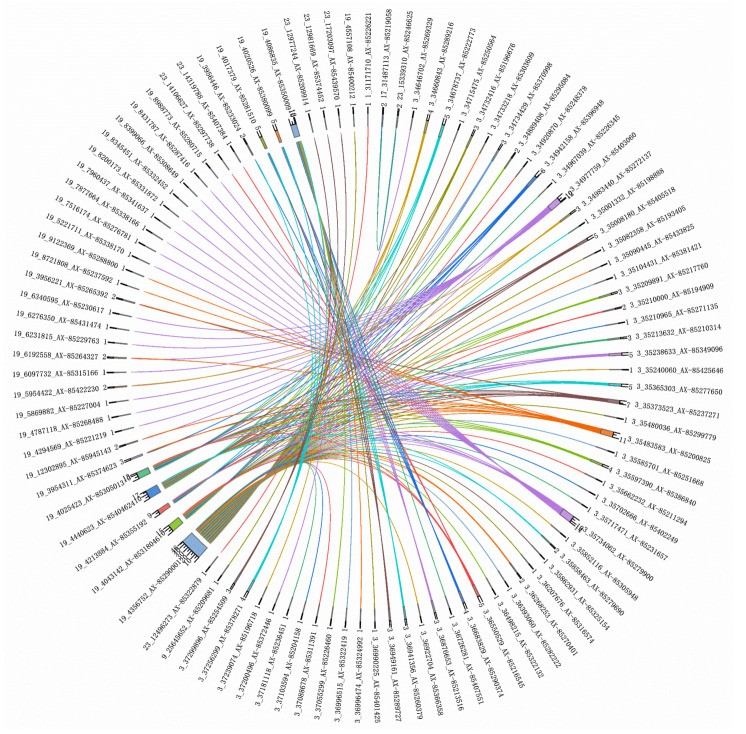
The shape of the skull plays a crucial role in the evolution and adaptation of species to their environments. In the case of aquaculture fish, the size of the head is also an important economic trait, as it is linked to fillet yield and ornamental value. This study applies our GRAMMAR-Lambda method to perform a genome-wide association study analysis on loci related to head size in catfish. Compared with traditional GWAS methods, the GRAMMAR-Lambda method offers higher computational efficiency, statistical power, and stability, especially in complex population structures. This research identifies many candidate genes closely related to cranial morphology in terms of head length, width, and depth in catfish, including bmpr1bb, fgfrl1b, nipbl, foxp2, and pax5, etc. Based on the results of gene-gene interaction analysis, we speculate that there may be frequent genetic interactions between chromosome 19 and chromosome 29 in bone development. Additionally, many candidate genes, gene families, and mechanisms (such as SOCE mechanisms) affecting skeletal development and morphology have been identified. These findings contribute to our understanding of the genetic architecture of head size and will support marker-assisted breeding in aquaculture, also reflecting the potential application of the GRAMMAR-Lambda method in genetic studies of complex traits.

Keywords: EMMAX; Ictalurus punctatus; genome-wide association study; linear mixed model; morphology.


Conflict of interest statement

The authors declare no conflicts of interest.

Figures

Figure 1
Figure 1
Manhattan (left) and QQ (right) plots for head length obtained using GRAMMAR-Lambda (Grl), GRAMMAR-Lambda-joint (Grl-joint), EMMAX, QFAM (conducted in PLINK), and GEMMA. The horizontal line in the Manhattan plots indicates the genome-wide significance threshold based on the Bonferroni correction.
Figure 2
Figure 2
Manhattan (left) and QQ (right) plots for head width obtained using GRAMMAR-Lambda (Grl), GRAMMAR-Lambda-joint (Grl-joint), EMMAX, QFAM (conducted in PLINK), and GEMMA. The horizontal line in the Manhattan plots indicates the genome-wide significance threshold based on the Bonferroni correction.
Figure 3
Figure 3
Manhattan (left) and QQ (right) plots for head depth obtained using GRAMMAR-Lambda (Grl), GRAMMAR-Lambda-joint (Grl-joint), EMMAX, QFAM (conducted in PLINK), and GEMMA. The horizontal line in the Manhattan plots indicates the genome-wide significance threshold based on the Bonferroni correction.
Figure 4
Figure 4
Chord diagram of additive-by-additive epistasis for the depth trait. The outer ring labels include chromosome numbers, base positions, and SNP IDs. The inner circle numbers represent the count of loci interacting with each SNP. (To avoid text overlap due to the extensive information, a smaller font size has been used. Please zoom in on the image for better clarity).
Figure 5
Figure 5
Chord diagram of additive-by-additive epistasis for the width trait. The outer ring labels include chromosome numbers, base positions, and SNP IDs. The inner circle numbers represent the count of loci interacting with each SNP.
Figure 6
Figure 6
Chord diagram of additive-by-additive epistasis for the length trait. The outer ring labels include chromosome numbers, base positions, and SNP IDs. The inner circle numbers represent the count of loci interacting with each SNP.
Figure 7
Figure 7
Pathway analysis of genes with epistatic interactions between chromosomes 19 and 29.

References

    1. Albertson R.C., Streelman J.T., Kocher T.D. Directional selection has shaped the oral jaws of Lake Malawi cichlid fishes. Proc. Natl. Acad. Sci. USA. 2003;100:5252–5257. doi: 10.1073/pnas.0930235100. - DOI - PMC - PubMed
    1. Chen L., Peng W., Kong S., Pu F., Chen B., Zhou Z., Feng J., Li X., Xu P. Genetic mapping of head size related traits in common carp (Cyprinus carpio) Front. Genet. 2018;9:448. doi: 10.3389/fgene.2018.00448. - DOI - PMC - PubMed
    1. Wünnenberg-Stapleton K., Blitz I.L., Hashimoto C., Cho K.W. Involvement of the small GTPases XRhoA and XRnd1 in cell adhesion and head formation in early Xenopus development. Development. 1999;126:5339–5351. doi: 10.1242/dev.126.23.5339. - DOI - PubMed
    1. Schoenebeck J.J., Ostrander E.A. The genetics of canine skull shape variation. Genetics. 2013;193:317–325. doi: 10.1534/genetics.112.145284. - DOI - PMC - PubMed
    1. Schoenebeck J.J., Hutchinson S.A., Byers A., Beale H.C., Carrington B., Faden D.L., Rimbault M., Decker B., Kidd J.M., Sood R. Variation of BMP3 contributes to dog breed skull diversity. PLoS Genet. 2012;8:e1002849. doi: 10.1371/journal.pgen.1002849. - DOI - PMC - PubMed

LinkOut - more resources