. 2024 Dec 24;13(1):1.
doi: 10.3390/biomedicines13010001.

mTOR Inhibitor Everolimus Modulates Tumor Growth in Small-Cell Carcinoma of the Ovary, Hypercalcemic Type and Augments the Drug Sensitivity of Cancer Cells to Cisplatin

Affiliations

mTOR Inhibitor Everolimus Modulates Tumor Growth in Small-Cell Carcinoma of the Ovary, Hypercalcemic Type and Augments the Drug Sensitivity of Cancer Cells to Cisplatin

Kewei Zheng et al. Biomedicines. .

Abstract

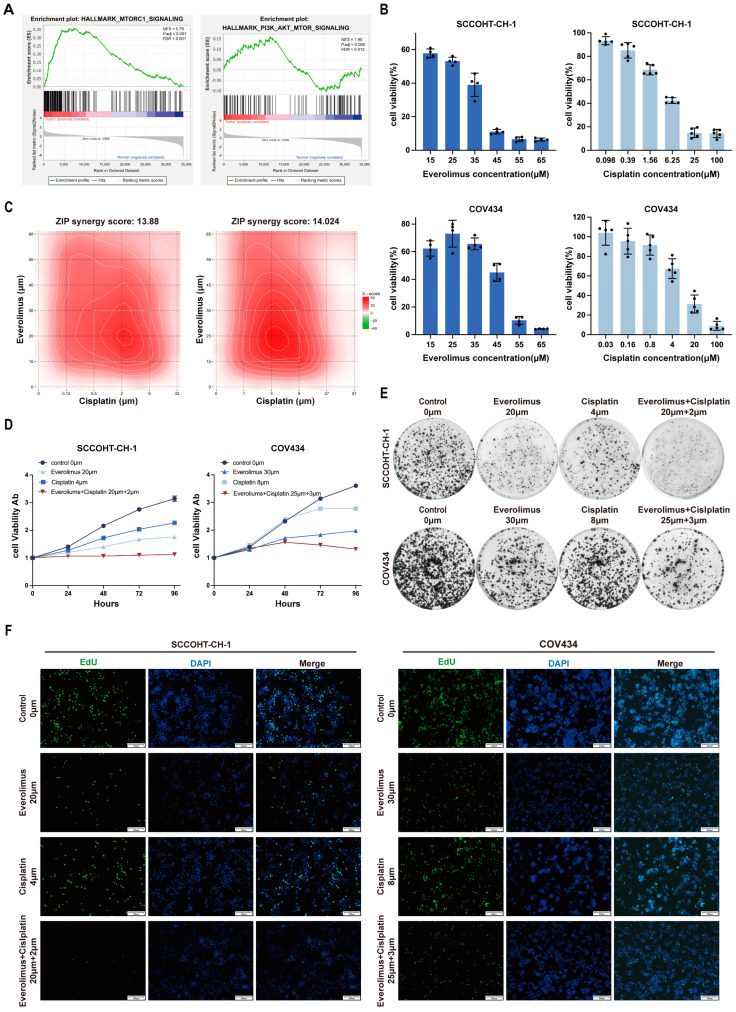
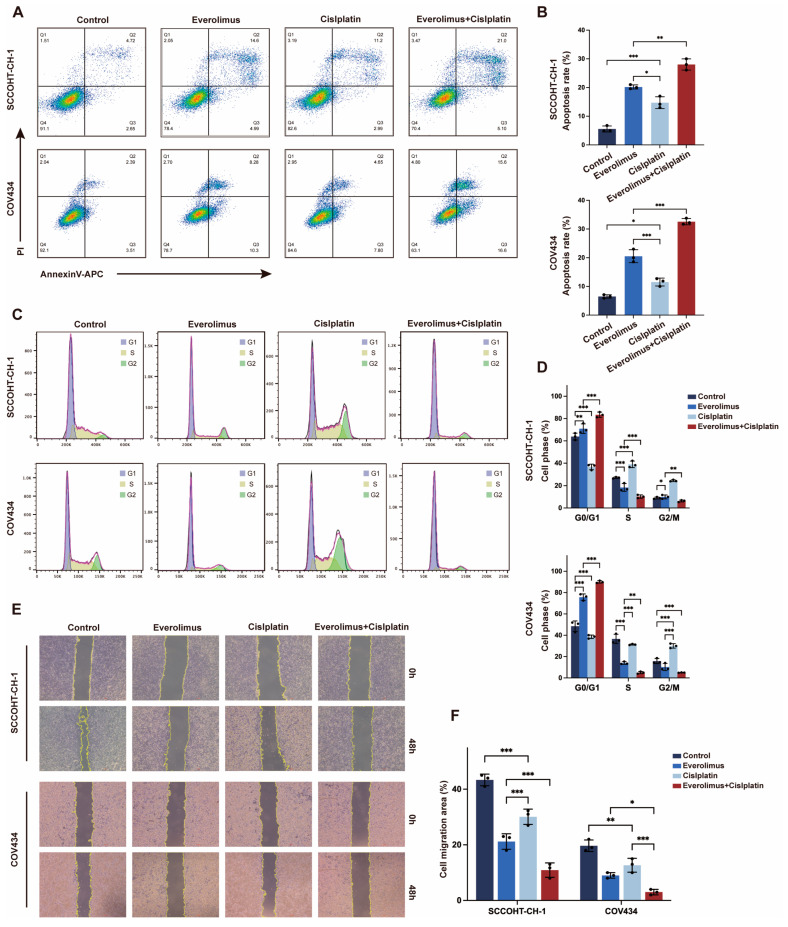
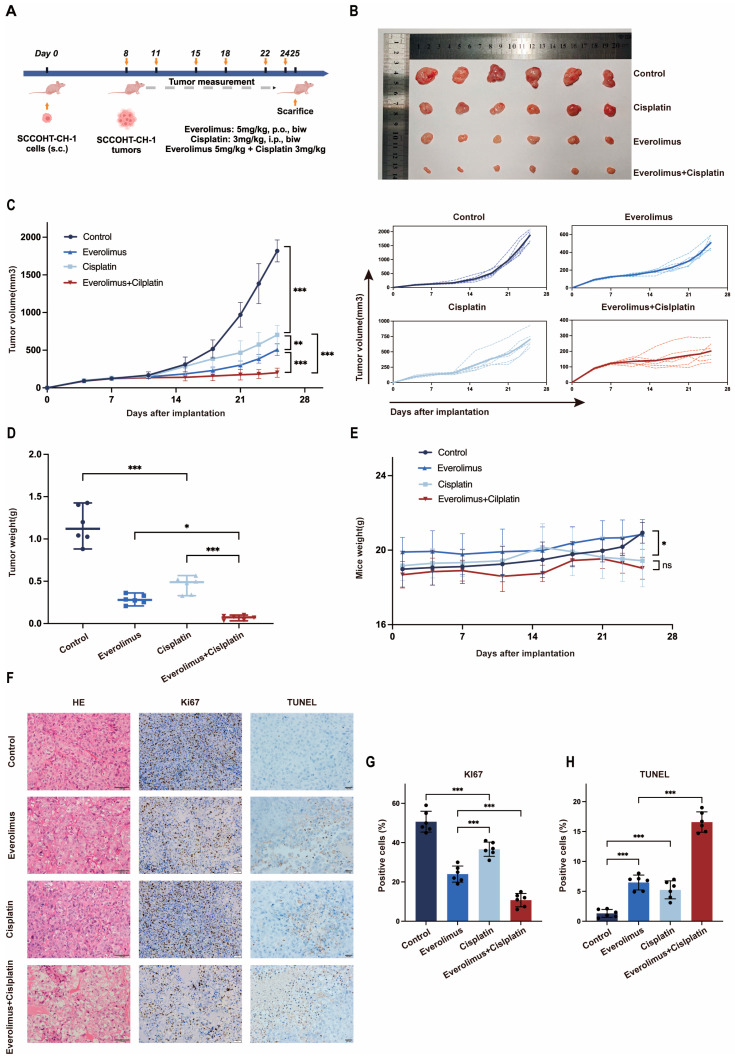
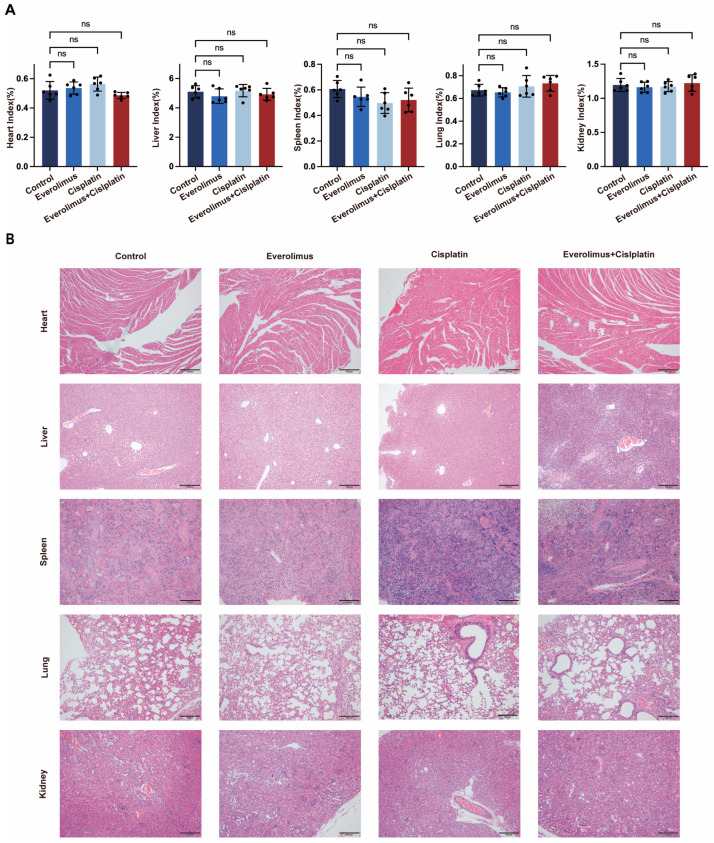
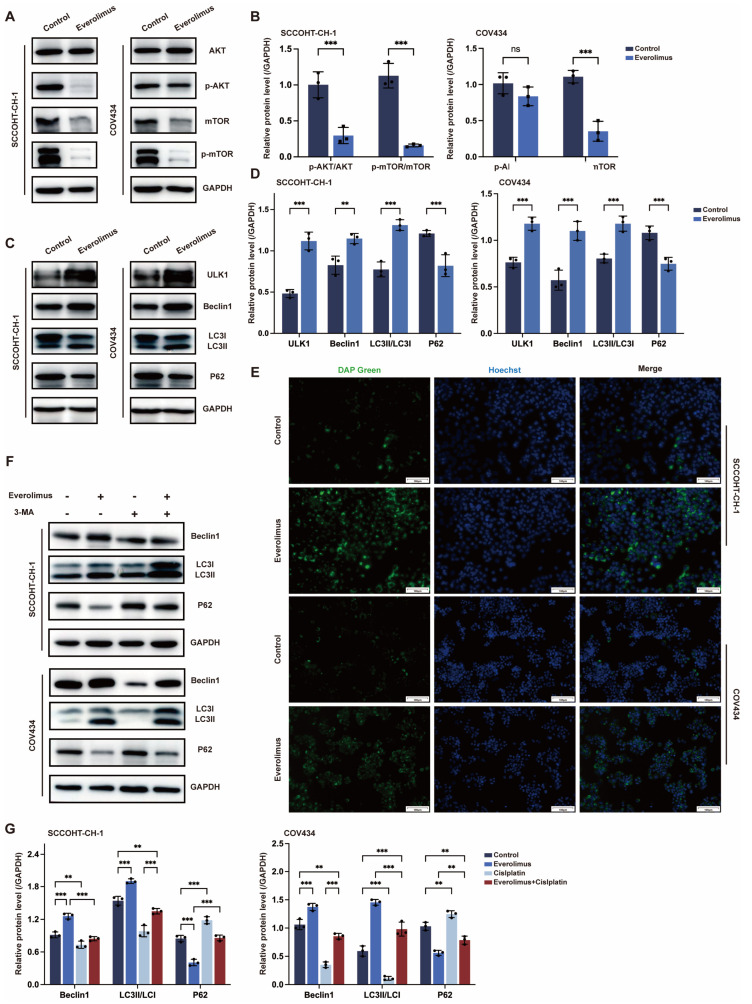
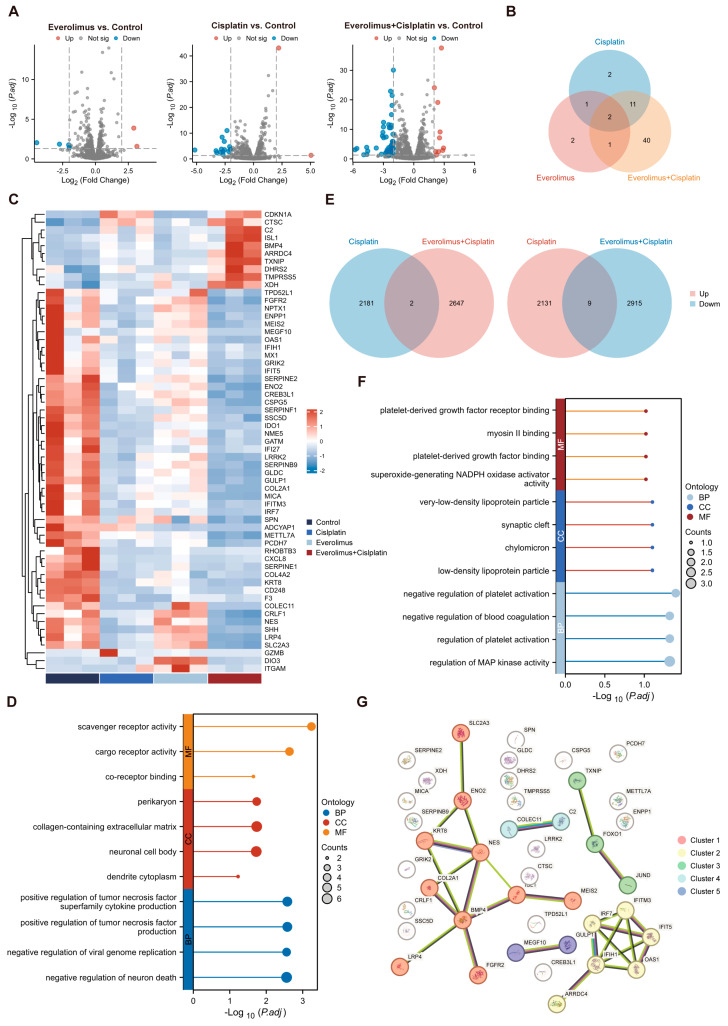
Background: Small-cell carcinoma of the ovary, hypercalcemic type (SCCOHT), is a rare and aggressive cancer with a poor prognosis and limited treatment options. Current chemotherapy regimens are predominantly platinum-based; however, the development of platinum resistance during treatment significantly worsens patient outcomes. Everolimus, an mTOR inhibitor, has been widely used in combination cancer therapies and has successfully enhanced the efficacy of platinum-based treatments. Method: In this study, we investigated the combined effects of everolimus and cisplatin on SCCOHT through both in vitro and in vivo experiments, complemented by RNA sequencing (RNA-seq) analyses to further elucidate the therapeutic impact. Result: Our findings revealed that everolimus significantly inhibits the proliferation of SCCOHT cells, induces cell cycle arrest, and accelerates apoptosis. When combined with cisplatin, everolimus notably enhances the therapeutic efficacy without increasing the toxicity typically associated with platinum-based drugs. RNA-seq analysis uncovered alterations in the expression of apoptosis-related genes, suggesting that the underlying mechanism involves autophagy regulation. Conclusions: Despite the current challenges in treating SCCOHT and the suboptimal efficacy of platinum-based therapies, the addition of everolimus significantly suppresses tumor growth. This indicates that everolimus enhances cisplatin efficacy by disrupting survival-promoting signaling cascades and inducing cell cycle arrest. Furthermore, it points to potential biomarkers for predicting therapeutic response.

Keywords: apoptosis; autophagy; combination therapy; hypercalcemic type; proliferation; small-cell carcinoma of the ovary; targeted therapy.


Conflict of interest statement

The authors declare that they have no conflict of interest.

Figures

Figure 1
Figure 1
Effect of everolimus combined with cisplatin on proliferation of SCCOHT cells. (A) GSEA enrichment analysis. (B) IC50 of everolimus and cisplatin against SCCOHT cells. Data are expressed as mean ± SD. (C) Heatmaps of drug combination responses. Everolimus and cisplatin act synergistically in SCCOHT-CH-1 cells. Everolimus and cisplatin at the indicated concentrations were used to treat cells for 48 h, and cell viability was assessed by CCK-8 assay. The ZIP synergy scores were calculated using SynergyFinder 3.0, with scores greater than 0 indicating synergism and scores exceeding 10 reflecting a strong synergistic interaction. The white rectangle on the heatmap delineates the concentrations that correspond to the highest degree of synergy. (D) The proliferation of everolimus and cisplatin on SCCOHT cells was assessed by CCK-8 assay. (E) The colony forming ability of SCCOHT cells treated with everolimus or cisplatin was assessed. (F) EdU staining was used to analyze the effects of everolimus and cisplatin on the proliferation of SCCOHT cells (Scale bar = 200 μm).
Figure 2
Figure 2
Everolimus in combination with cisplatin induced cell cycle arrest and increased apoptosis in SCCOHT cells. (A,B) apoptosis, (C,D) cell cycle analysis, and (E,F) wound healing assay. Error bars represent the standard deviation (Scale bar = 100 μm). Error bars represent the standard deviation, * p < 0.05, ** p < 0.01, *** p < 0.001.
Figure 3
Figure 3
Everolimus combined with cisplatin enhanced the inhibition of tumor growth in vivo. (A) Administration regimen for tumor-bearing mice. (B) Mouse tumor images. Tumor volume and spaghetti curves of tumor volume (C), tumor weight (D), and mouse weight (E) in different groups of mice. (FH) HE staining of tumor tissues, immunohistochemical analysis of Ki67 expression, and TUNEL staining in different groups of tumor tissues (Scale barHE, Ki67 = 1000 µm, Scale barTUNEL = 500 µm). Error bars represent the standard deviation, ns: not significant, * p < 0.05, ** p < 0.01, *** p < 0.001.
Figure 4
Figure 4
In vivo toxicity analysis. (A) The heart, liver, spleen, lung, kidney, and other organ indices of the animal at the end of the in vivo experiment. (B) HE staining of mouse organs (Scale bar = 100 µm). Error bars represent the standard deviation, ns: not significant.
Figure 5
Figure 5
(A,B) Western blot analysis of phosphorylation of AKT and mTOR in SCCOHT cells of the control group and everolimus group. (C,D) Western blot analysis of changes in autophagy-associated protein levels in the control group and the everolimus group. (E) Representative images for the detection of the autophagy flux by staining with DAL®Green (green) (Scale bar = 100 µm). (F,G) The expression levels of autophagy related proteins and autophagy substrates in SCCOHT cells treated with everolimus, 3-MA, or everolimus + 3-MA were detected by Western blot analysis. Error bars represent the standard deviation, ns: not significant, ** p < 0.01, *** p < 0.001.
Figure 6
Figure 6
Regulation of apoptosis-related genes by everolimus and cisplatin. (A) Volcano maps showed differential expressions of apoptosis-related genes after different treatments. Genes with log2(FC) > 2 or log2(FC) < −2 are considered biologically significant. The red picture shows significantly upregulated gene (adjP < 0.05); The blue chart shows well downregulated genes (adjP < 0.05). (B) Venn diagram showed the differential expression of apoptosis-related genes after different treatments. (C) Heat maps showing the fold changes (logarithmic transformation) in apoptosis-related genes in different treatment groups. Calculate the fold change relative to the average of the control group. The shaded range from blue to red indicates downregulated genes to upregulated genes. (D) GO analysis of the 40 unique apoptosis-related genes. (E) Venn maps of upregulated and downregulated genes in cisplatin group and two-drug combination group. (F) GO analysis of the 11 reversed genes. (G) The PPI network for the 40 unique apoptosis-related genes and two specific reversed resistance genes.

Similar articles

Cited by

References

    1. Tischkowitz M., Huang S., Banerjee S., Hague J., Hendricks W.P.D., Huntsman D.G., Lang J.D., Orlando K.A., Oza A.M., Pautier P., et al. Small-Cell Carcinoma of the Ovary, Hypercalcemic Type-Genetics, New Treatment Targets, and Current Management Guidelines. Clin. Cancer Res. Off. J. Am. Assoc. Cancer Res. 2020;26:3908–3917. doi: 10.1158/1078-0432.CCR-19-3797. - DOI - PMC - PubMed
    1. Young R.H., Oliva E., Scully R.E. Small cell carcinoma of the ovary, hypercalcemic type. A clinicopathological analysis of 150 cases. Am. J. Surg. Pathol. 1994;18:1102–1116. doi: 10.1097/00000478-199411000-00004. - DOI - PubMed
    1. Jamy O., Yaghmour G., Hare F., Martin M.G. Population-based Analysis of the Clinical Features of Primary Small Cell Carcinoma of the Ovary. Anticancer Res. 2015;35:3091–3095. - PubMed
    1. Harrison M.L., Hoskins P., du Bois A., Quinn M., Rustin G.J., Ledermann J.A., Baron-Hay S., Friedlander M.L. Small cell of the ovary, hypercalcemic type—Analysis of combined experience and recommendation for management. A GCIG study. Gynecol. Oncol. 2006;100:233–238. doi: 10.1016/j.ygyno.2005.10.024. - DOI - PubMed
    1. Ray-Coquard I., Morice P., Lorusso D., Prat J., Oaknin A., Pautier P., Colombo N. Non-epithelial ovarian cancer: ESMO Clinical Practice Guidelines for diagnosis, treatment and follow-up. Ann. Oncol. Off. J. Eur. Soc. Med. Oncol. 2018;29:iv1–iv18. doi: 10.1093/annonc/mdy001. - DOI - PubMed

LinkOut - more resources