. 2024 Dec 31;15(1):38.
doi: 10.3390/biom15010038.

NADH Reductive Stress and Its Correlation with Disease Severity in Leigh Syndrome: A Pilot Study Using Patient Fibroblasts and a Mouse Model

Affiliations

NADH Reductive Stress and Its Correlation with Disease Severity in Leigh Syndrome: A Pilot Study Using Patient Fibroblasts and a Mouse Model

Tamaki Ishima et al. Biomolecules. .

Abstract

Nicotinamide adenine dinucleotide (NAD) is a critical cofactor in mitochondrial energy production. The NADH/NAD+ ratio, reflecting the balance between NADH (reduced) and NAD+ (oxidized), is a key marker for the severity of mitochondrial diseases. We recently developed a streamlined LC-MS/MS method for the precise measurement of NADH and NAD+. Utilizing this technique, we quantified NADH and NAD+ levels in fibroblasts derived from pediatric patients and in a Leigh syndrome mouse model in which mitochondrial respiratory chain complex I subunit Ndufs4 is knocked out (KO). In patient-derived fibroblasts, NAD+ levels did not differ significantly from those of healthy controls (p = 0.79); however, NADH levels were significantly elevated (p = 0.04), indicating increased NADH reductive stress. This increase, observed despite comparable total NAD(H) levels between the groups, was attributed to elevated NADH levels. Similarly, in the mouse model, NADH levels were significantly increased in the KO group (p = 0.002), further suggesting that NADH elevation drives reductive stress. This precise method for NADH measurement is expected to outperform conventional assays, such as those for lactate, providing a simpler and more reliable means of assessing disease progression.

Keywords: LC-MS/MS; Leigh syndrome; NADH; Ndufs4-KO mice; mitochondrial diseases; reductive stress.


Conflict of interest statement

The authors declare no conflicts of interest.

Figures

Figure 1
Figure 1
NAD(H) Levels in Mitochondrial Disease Fibroblasts. Comparison of NAD(H) levels in fibroblasts derived from patients with mitochondrial disease (n = 22) and healthy controls (n = 5). (a) NADH levels were significantly higher in patients compared to controls. (b) NAD+ levels remained unchanged in both patients and controls. (c) The NADH/NAD+ ratio was significantly elevated in patients compared to controls. (d) Total NAD(H) levels, representing the sum of NADH and NAD+, were comparable between patients and controls. Data are presented as * p < 0.05, ** p < 0.01; NS = not significant, p > 0.05.
Figure 2
Figure 2
NAD(H) Levels in Mouse Brain Samples. Comparison of NAD(H) levels in brain samples from Ndufs4 knockout (KO) mice (n = 5) and wild-type (WT) controls (n = 5). (a) NADH levels were significantly higher in KO compared to WT mice. (b) NAD+ levels remained unchanged in both KO and WT mice. (c) The NADH/NAD+ ratio was significantly elevated in KO compared to WT mice. (d) Total NAD(H) levels, representing the sum of NADH and NAD+, were comparable between KO and WT mice. Data are presented as ** p < 0.01, *** p < 0.001, NS = not significant, p > 0.05.
Figure 3
Figure 3
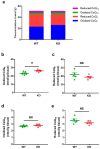
CoQ Levels in Brain Samples from Ndufs4 Knockout (KO) and Wild-Type (WT) Mice. Comparison of CoQ levels in brain samples from Ndufs4 knockout (KO) mice (n = 5) and wild-type (WT) controls (n = 5). (a) Total CoQ was comparable in WT and KO mice. (b) Oxidized CoQ9 levels were significantly higher in KO compared to WT mice. (c) Reduced CoQ9 levels remained unchanged in KO and WT mice. (d) Oxidized CoQ10 levels showed no difference between KO and WT mice. (e) Reduced CoQ10 levels were also unchanged in KO and WT mice. Data are expressed as * p < 0.05, NS = not significant, p > 0.05.

References

    1. Gusic M., Prokisch H. Genetic basis of mitochondrial diseases. FEBS Lett. 2021;595:1132–1158. doi: 10.1002/1873-3468.14068. - DOI - PubMed
    1. Wortmann S.B., Koolen D.A., Smeitink J.A., van den Heuvel L., Rodenburg R.J. Whole exome sequencing of suspected mitochondrial patients in clinical practice. J. Inherit. Metab. Dis. 2015;38:437–443. doi: 10.1007/s10545-015-9823-y. - DOI - PMC - PubMed
    1. Steele H.E., Horvath R., Lyon J.J., Chinnery P.F. Monitoring clinical progression with mitochondrial disease biomarkers. Brain J. Neurol. 2017;140:2530–2540. doi: 10.1093/brain/awx168. - DOI - PMC - PubMed
    1. Kobayashi M., Morishita H., Sugiyama N., Yokochi K., Nakano M., Wada Y., Hotta Y., Terauchi A., Nonaka I. Two cases of NADH-coenzyme Q reductase deficiency: Relationship to MELAS syndrome. J. Pediatr. 1987;110:223–227. doi: 10.1016/S0022-3476(87)80158-0. - DOI - PubMed
    1. Hirano M., Ricci E., Koenigsberger M.R., Defendini R., Pavlakis S.G., DeVivo D.C., DiMauro S., Rowland L.P. Melas: An original case and clinical criteria for diagnosis. Neuromuscul. Disord. NMD. 1992;2:125–135. doi: 10.1016/0960-8966(92)90045-8. - DOI - PubMed

LinkOut - more resources