. 2025 Jan 9;26(2):492.
doi: 10.3390/ijms26020492.

GmGIF5 Promotes Cell Expansion by Negatively Regulating Cell Wall Modification

Affiliations

GmGIF5 Promotes Cell Expansion by Negatively Regulating Cell Wall Modification

Hongmiao Jin et al. Int J Mol Sci. .

Abstract

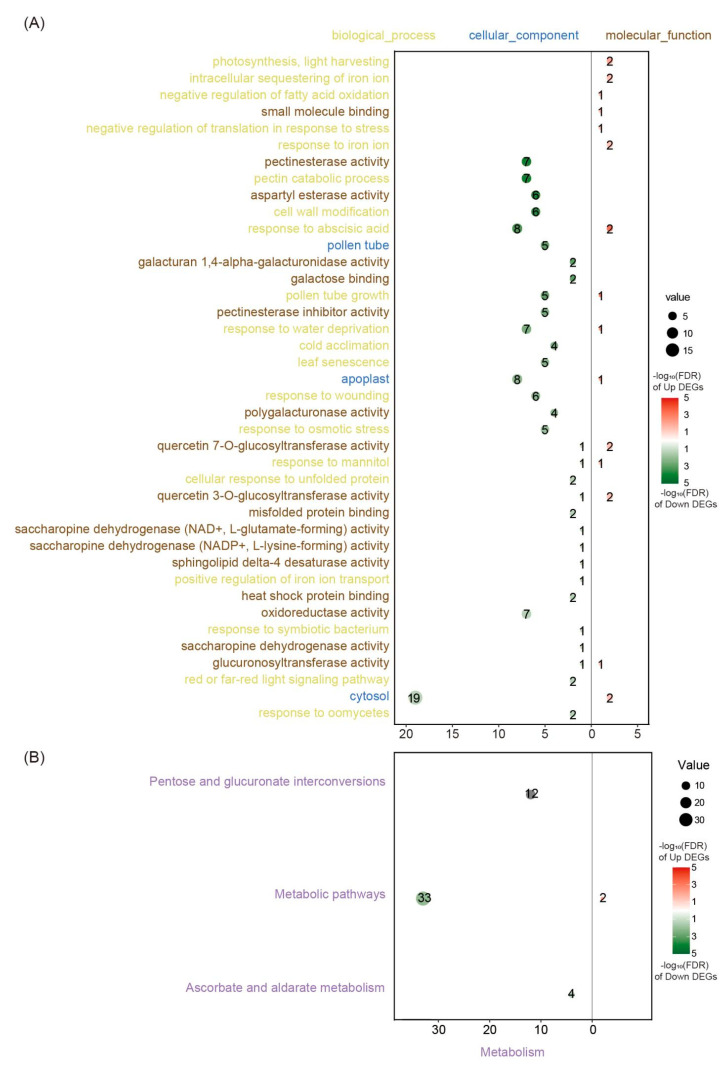
Soybean is an important and versatile crop worldwide. Enhancing soybean architecture offers a potential method to increase yield. Plant-specific transcription factors play a crucial, yet often unnoticed, role in regulating plant growth and development. GRF-INTERACTING FACTOR (GIF) genes are plant-specific transcription factors; however, their functions in soybean remain poorly understood. Eight GmGIF members were identified in soybean (Glycine max L.). Phylogenetic analysis divided the eight GmGIF proteins into three groups. In this study, we focused on the role of GmGIF5 owing to its high expression level in the meristem. Subcellular localization and transcriptional activity analysis showed that GmGIF5 was localized to the nucleus and has self-transactivation ability. To elucidate the biological function of GmGIF5, we constructed transgenic Arabidopsis lines overexpressing the gene. Phenotype observations indicated that the overexpression of GmGIF5 contributed to larger leaves, higher plants, wider stems, and larger seeds. The organs of GmGIF5 overexpression lines exhibited larger sizes primarily due to an increase in cell size rather than cell number. RNA sequencing was performed to investigate the underlying mechanism for these effects, showing that differentially expressed genes in overexpression lines were mainly enriched in cell wall modification processes. Our study provides new clues for an understanding of the roles of the GmGIF family in soybean, which can promote the further application of these genes in genetic breeding.

Keywords: GRF-INTERACTING FACTORs; RNA-seq; cell expansion; soybean; transcription factor.


Conflict of interest statement

The authors declare no conflicts of interest.

Figures

Figure 1
Figure 1
The expression profiles of GmGIF genes in soybean tissues. (A) The expression patterns of GmGIF genes across various tissues were analyzed using transcriptome data, with FPKM values employed to construct this heatmap. Gene IDs of the analyzed genes can be found in Table S1. (B) RT-qPCR analysis to reveal GmGIF expression patterns in various soybean tissues. The letters of the alphabet represent the results of multiple comparisons when p = 0.05.
Figure 2
Figure 2
Transcriptional activity and subcellular localization analysis of GmGIF5. (A) Self-transactivation assay of GmGIF5 in yeast. Yeast cells harboring the BD-GmGIF5, positive control BD-GmNAN181 or negative control BD-EV transformation products were grown on an SD/-Trp medium and SD/-His/-Leu/-Trp medium. (B) Tobacco leaves were transformed with a plasmid harboring GFP or the GmGIF5–GFP fusion construct. Tobacco leaves transformed with 35S::GFP served as the control. The detection of fluorescence was performed under a confocal laser-scanning microscope. Scale bar = 20 μm.
Figure 3
Figure 3
Overexpression of GmGIF5 promotes leaf development. (A) RT-qPCR examination of transgenic Arabidopsis lines. (B,C) Observation of transgenic Arabidopsis lines at 30 days and 45 days after transplantation. (D) Morphological observation of leaves on the entire plant 45 days after transplanting. (EI) Measurements of leaf size, petiole length, and epidermal cell size 45 days after transplantation. Boxes represent the median values and the first and third quartiles; whiskers represent the minimum and maximum values. The dots represent single values in boxplots. **** p < 0.0001 (Student’s t-test). The letters of the alphabet represent the results of multiple comparisons when p = 0.05.
Figure 4
Figure 4
Overexpression of GmGIF5 enhances stem development. Plant height (A,B) and stem width (C,D) of transgenic lines and the wild type (WT) at 75 days after transplantation. (EH) Measurement of stem cell size in overexpression lines and wild-type lines. Boxes represent the median values and the first and third quartiles; whiskers represent the minimum and maximum values. The dots represent single values in boxplots. * p < 0.05, *** p < 0.001, and **** p < 0.0001 (Student’s t-test).
Figure 5
Figure 5
Overexpression of GmGIF5 affects seed size. (A,B) Seed phenotype of transgenic lines and the WT at 75 days after transplantation. (CF) Measurement of seed length (C), seed width (D), seed size (E), and thousand-seed weight (F) in overexpression lines and wild-type lines. Boxes represent the median values and the first and third quartiles; whiskers represent the minimum and maximum values. The dots represent single values in boxplots. * p < 0.05, ** p < 0.01, *** p < 0.001, and **** p < 0.0001 (Student’s t-test).
Figure 6
Figure 6
Function enrichment analysis of differentially expressed genes between overexpression 2 (OE2) and wild-type (WT) lines. (A) Gene Ontology (GO) and (B) Kyoto Encyclopedia of Genes and Genomes (KEGG) pathway enrichment of differentially expressed genes between OE2 and WT lines. Yellow indicates biological process terms, blue indicates cellular component terms, and brown indicates molecular function terms. Purple indicates metabolic pathways. Upregulated genes are shown in red, and downregulated genes are shown in green. The size of the dots reflects the number of genes. The numbers on the dots show the number of enriched genes..
Figure 7
Figure 7
Expression profiles of differentially expressed genes among wild-type (WT) and overexpression 2 (OE2) lines. (A) Functional classification of differentially expressed genes and their expression profiles. Log2 fold change values are shown along the color scale varying from blue to red; a deeper color indicates a more dramatic change. (B) Expression analysis of differentially expressed genes in WT and OE2 lines. * p < 0.05, ** p < 0.01 (Student’s t-test).

References

    1. Liu S., Zhang M., Feng F., Tian Z. Toward a “Green Revolution” for Soybean. Mol. Plant. 2020;13:688–697. doi: 10.1016/j.molp.2020.03.002. - DOI - PubMed
    1. Machado F.B., Moharana K.C., Almeida-Silva F., Gazara R.K., Pedrosa-Silva F., Coelho F.S., Grativol C., Venancio T.M. Systematic Analysis of 1298 RNA-seq Samples and Construction of a Comprehensive Soybean (Glycine max) Expression Atlas. Plant J. 2020;103:1894–1909. doi: 10.1111/tpj.14850. - DOI - PubMed
    1. Yu T.F., Hou Z.H., Wang H.L., Chang S.Y., Song X.Y., Zheng W.J., Zheng L., Wei J.T., Lu Z.W., Chen J., et al. Soybean Steroids Improve Crop Abiotic Stress Tolerance and Increase Yield. Plant Biotechnol. J. 2024;22:2333–2347. doi: 10.1111/pbi.14349. - DOI - PMC - PubMed
    1. Chen L., Yang H., Fang Y., Guo W., Chen H., Zhang X., Dai W., Chen S., Hao Q., Yuan S., et al. Overexpression of GmMYB14 Improves High-Density Yield and Drought Tolerance of Soybean through Regulating Plant Architecture Mediated by the Brassinosteroid Pathway. Plant Biotechnol. J. 2021;19:702–716. doi: 10.1111/pbi.13496. - DOI - PMC - PubMed
    1. Wang H.W., Zhang B., Hao Y.J., Huang J., Tian A.G., Liao Y., Zhang J.S., Chen S.Y. The Soybean Dof-Type Transcription Factor Genes, GmDof4 and GmDof11, Enhance Lipid Content in the Seeds of Transgenic Arabidopsis Plants. Plant J. 2007;52:716–729. doi: 10.1111/j.1365-313X.2007.03268.x. - DOI - PubMed

MeSH terms

LinkOut - more resources