. 2025 Jan 10;26(2):549.
doi: 10.3390/ijms26020549.

The Type III Intermediate Filament Protein Peripherin Regulates Lysosomal Degradation Activity and Autophagy

Affiliations

The Type III Intermediate Filament Protein Peripherin Regulates Lysosomal Degradation Activity and Autophagy

Roberta Romano et al. Int J Mol Sci. .

Abstract

Peripherin belongs to heterogeneous class III of intermediate filaments, and it is the only intermediate filament protein selectively expressed in the neurons of the peripheral nervous system. It has been previously discovered that peripherin interacts with proteins important for the endo-lysosomal system and for the transport to late endosomes and lysosomes, such as RAB7A and AP-3, although little is known about its role in the endocytic pathway. Here, we show that peripherin silencing affects lysosomal abundance but also positioning, causing the redistribution of lysosomes from the perinuclear area to the cell periphery. Moreover, peripherin silencing affects lysosomal activity, inhibiting EGFR degradation and the degradation of a fluorogenic substrate for proteases. Furthermore, we demonstrate that peripherin silencing affects lysosomal biogenesis by reducing the TFEB and TFE3 contents. Finally, in peripherin-depleted cells, the autophagic flux is strongly inhibited. Therefore, these data indicate that peripherin has an important role in regulating lysosomal biogenesis, and positioning and functions of lysosomes, affecting both the endocytic and autophagic pathways. Considering that peripherin is the most abundant intermediate filament protein of peripheral neurons, its dysregulation, affecting its functions, could be involved in the onset of several neurodegenerative diseases of the peripheral nervous system characterized by alterations in the endocytic and/or autophagic pathways.

Keywords: autophagy; cytoskeleton; intermediate filaments; lysosome; peripherin.


Conflict of interest statement

The authors declare no conflicts of interest.

Figures
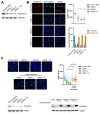
Figure 1
Figure 1
Peripherin silencing affects LAMP1 abundance and lysosomal localization. (A,B) Neuro2a cells were treated with 2 siRNAs against peripherin mRNA, individually or in combination, or with a control RNA as a negative control. After 96 h of transfection, the cells were lysed, and the samples were subjected to a Western blot analysis using antibodies against peripherin with GAPDH used as the loading control (A), or cells were fixed, permeabilized, and immunolabeled with anti-peripherin and anti-LAMP1 antibodies followed by Alexa568- and Alexa488-conjugated secondary antibodies, while the nuclei were stained with DAPI (B). Bar = 10 µM. ImageJ software 1.54d was used for the CTCF calculation, and the percentage of cells with compact or dispersed lysosomes was calculated. (C) Neuro2a cells were silenced as indicated for 48 h and then transfected for 48 h with a plasmid encoding myc-tagged peripherin. Cells were then fixed, permeabilized, and immunolabeled with anti-LAMP1 antibody followed by an Alexa488-conjugated secondary antibody. Nuclei were stained with DAPI. Bar = 10 µM. The CTCF was calculated using ImageJ. To control silencing and transfection, a Western blot analysis was performed using antibodies against peripherin, and Hsp90 was used as the loading control. *** = p < 0.001.
Figure 2
Figure 2
Peripherin silencing affects lysosomal functionality. (A) Lysates of peripherin-silenced or control Neuro2a cells, as indicated, were subjected to Western blot analysis using antibodies against LAMP1, RAB7A, beclin 1, RILP, V1G1, peripherin, and Hsp90. Relative protein abundance was quantified by densitometric analysis normalizing against Hsp90. (B) Peripherin-silenced or control Neuro2A cells, as indicated, were subjected to immunofluorescence analysis using anti-TFEB antibody followed by Alexa488-conjugated secondary antibody, while nuclei were stained with DAPI. Bar = 10 µM. TFEB CTCF was calculated using ImageJ software. To check silencing efficiency, Western blot analysis was performed on same samples using antibodies against peripherin and Hsp90 as loading control. Samples of control and silenced cells were also subjected to Western blot analysis using antibodies against TFEB and TFE3. Relative protein abundance was quantified by densitometric analysis normalizing against Hsp90. (C) Lysates of control or peripherin-depleted Neuro2a cells were subjected to Western blot analysis using antibodies against RAB4, RAB5, RAB9, RAB11, peripherin, or Hsp90 as loading control. Relative protein abundance was quantified by densitometric analysis normalizing against Hsp90. (D) Peripherin-silenced or control Neuro2A cells were incubated with DQ-Red BSA for 8 h and then fixed and immunolabeled using anti-peripherin antibody followed by Alexa488-conjugated secondary antibody. Nuclei were stained with DAPI. Bar = 10 µM. DQ-BSA CTCF was calculated using ImageJ. (E) Peripherin-silenced or control Neuro2A cells were treated with cycloheximide for 1 h and then stimulated with EGF for 15 min and 3 h. Lysates were then subjected to Western blot analysis using antibodies against EGFR, peripherin, and β-actin as loading control. Percentage of degraded EGFR was calculated. (F) Lysates of control or peripherin-silenced Neuro2a cells were subjected to Western blot analysis using antibodies against p62, V0D1, peripherin, or Hsp90 as loading control. Relative protein abundance was quantified by densitometric analysis normalizing against Hsp90. * = p < 0.05; ** = p < 0.01; *** = p < 0.001.
Figure 3
Figure 3
Peripherin silencing affects the autophagic flux but not apoptosis. (A) After 96 h, peripherin-silenced or control Neuro2a cells, as indicated, were incubated with full medium (FM) or full medium supplemented with 100 nM bafilomycin A1 (BAF) for 3 h. Lysates were subjected to a Western blot analysis using antibodies against LC3B, peripherin, and MAPK1 as the loading control. LC3B-II abundance was quantified by a densitometric analysis normalizing against MAPK1. Autophagic flux was calculated as the ratio between normalized LC3B-II in bafilomycin A1-treated and full-medium samples. (B) Lysates of the control or peripherin-silenced Neuro2a cells were subjected to a Western blot analysis using antibodies against caspase 9, caspase 3, peripherin, or Tubulin as the loading control. The cleavage of caspases was calculated as the ratio between cleaved caspase and pro-caspase. ** = p < 0.01.
Figure 4
Figure 4
Peripherin expression after silencing rescues TFEB abundance and lysosomal functionality. (A) Peripherin-silenced or control Neuro2A cells, after 48 h, were transfected with a plasmid encoding myc-tagged peripherin, and after another 48 h, they were fixed, permeabilized, and immunolabeled using an anti-TFEB antibody followed by an Alexa488-conjugated secondary antibody. Nuclei were stained with DAPI. Bar = 10 µM. TFEB CTCF was calculated using ImageJ. To check transfection, a Western blot analysis was performed using anti-peripherin and anti-Hsp90 antibodies, with the latter being used as a loading control. (B) Peripherin-silenced or control Neuro2A cells after 48 h were transfected with a plasmid encoding myc-tagged peripherin, and after another 48 h, they were treated with DQ-Green BSA for 8 h and then fixed. Nuclei were stained with DAPI. Bar = 10 µM. DQ-BSA CTCF was calculated using ImageJ. To check transfection, a Western blot analysis was performed using anti-peripherin and anti-Hsp90 antibodies, with the latter being used as a loading control. ** = p < 0.01; *** = p < 0.001.
Figure 5
Figure 5
Peripherin silencing affects lysosomal biogenesis and functionality in NSC34 cells. (A) NSC34 cells were treated with peripherin siRNA or with a control RNA for 96 h, incubated with DQ-Green BSA for 8 h, and then fixed. Nuclei were stained with DAPI. Bar = 10 µM. DQ-BSA CTCF was calculated using ImageJ. To control silencing, a Western blot analysis was performed using antibodies against peripherin, and Hsp90 was used as the loading control. (B,C) NSC34 cells were treated with peripherin siRNAs or with a control RNA for 96 h, fixed, permeabilized, and immunolabeled with anti-TFEB (B) or anti-LAMP1 (C) antibodies followed by an Alexa488-conjugated secondary antibody. Nuclei were stained with DAPI. Bar = 10 µM. ImageJ software was used for the CTCF calculation. (D) NSC34 cells were treated with peripherin siRNA or with a control RNA for 48 h and then transfected using a plasmid coding for myc-peripherin. After 48 h, cells were lysed, and samples were subjected to a Western blot analysis to check silencing and transfection or treated with DQ-BSA. Nuclei were stained with DAPI. Bar = 10 µM. DQ-BSA CTCF was calculated using ImageJ. *** = p < 0.001.
Figure 6
Figure 6
Peripherin overexpression is associated with an increased abundance of TFEB in Neuro2a cells. HeLa cells (A) or Neuro2a cells (B) were transfected with a plasmid coding for myc-peripherin for 48 h, and then they were fixed and immunolabeled using antibodies against myc and TFEB followed by Alexa568- and Alexa488-conjugated secondary antibodies, while the nuclei were stained with DAPI. Bar = 10 µM. TFEB CTCF was calculated using ImageJ software. * = p < 0.05.
Figure 7
Figure 7
Peripherin overexpression does not affect the autophagic flux. HeLa cells (A) or Neuro2a cells (B) were transfected with plasmid coding for myc-peripherin for 48 h. Cells were then treated with 100 nM bafilomycin A1 for three hours and then fixed and immunolabeled using antibodies against myc and LC3B, followed by Alexa488- and Alexa568-conjugated secondary antibodies, while the nuclei were stained with DAPI. Bar = 10 µM. LC3B dots were calculated using ImageJ software. The autophagic flux was calculated as the ratio between LC3B-II dots in bafilomycin A1-treated and full-medium samples.

Similar articles

Cited by

References

    1. Hohmann T., Dehghani F. The Cytoskeleton—A Complex Interacting Meshwork. Cells. 2019;8:362. doi: 10.3390/cells8040362. - DOI - PMC - PubMed
    1. Pradeau-Phelut L., Etienne-Manneville S. Cytoskeletal crosstalk: A focus on intermediate filaments. Curr. Opin. Cell Biol. 2024;87:102325. doi: 10.1016/j.ceb.2024.102325. - DOI - PubMed
    1. Fletcher D.A., Mullins R.D. Cell mechanics and the cytoskeleton. Nature. 2010;463:485–492. doi: 10.1038/nature08908. - DOI - PMC - PubMed
    1. Brangwynne C.P., MacKintosh F.C., Kumar S., Geisse N.A., Talbot J., Mahadevan L., Parker K.K., Ingber D.E., Weitz D.A. Microtubules can bear enhanced compressive loads in living cells because of lateral reinforcement. J. Cell Biol. 2006;173:733–741. doi: 10.1083/jcb.200601060. - DOI - PMC - PubMed
    1. Pollard T.D., Borisy G.G. Cellular motility driven by assembly and disassembly of actin filaments. Cell. 2003;112:453–465. doi: 10.1016/S0092-8674(03)00120-X. - DOI - PubMed

Substances

LinkOut - more resources