. 2025 Jan 14;26(2):644.
doi: 10.3390/ijms26020644.

Ultrastructural Study and Immunohistochemical Characteristics of Mesencephalic Tegmentum in Juvenile Chum Salmon (Oncorhynchus keta) Brain After Acute Traumatic Injury

Affiliations

Ultrastructural Study and Immunohistochemical Characteristics of Mesencephalic Tegmentum in Juvenile Chum Salmon (Oncorhynchus keta) Brain After Acute Traumatic Injury

Evgeniya V Pushchina et al. Int J Mol Sci. .

Abstract

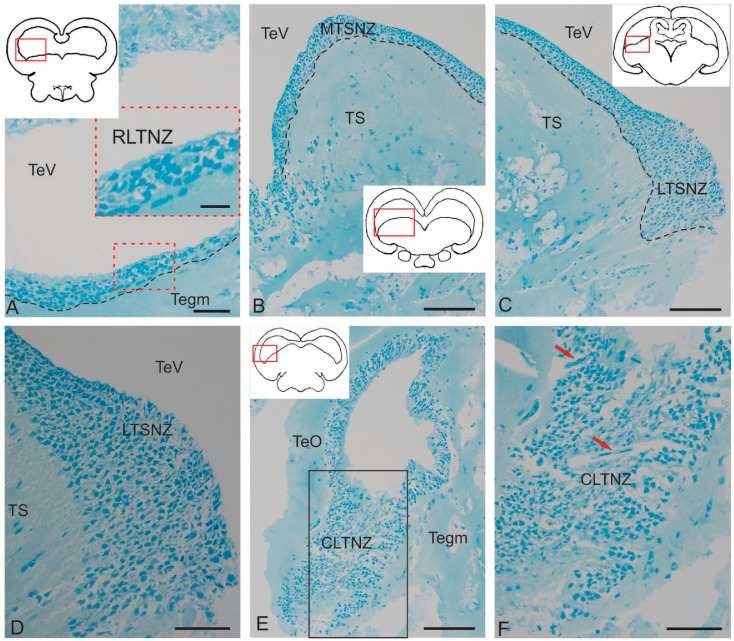
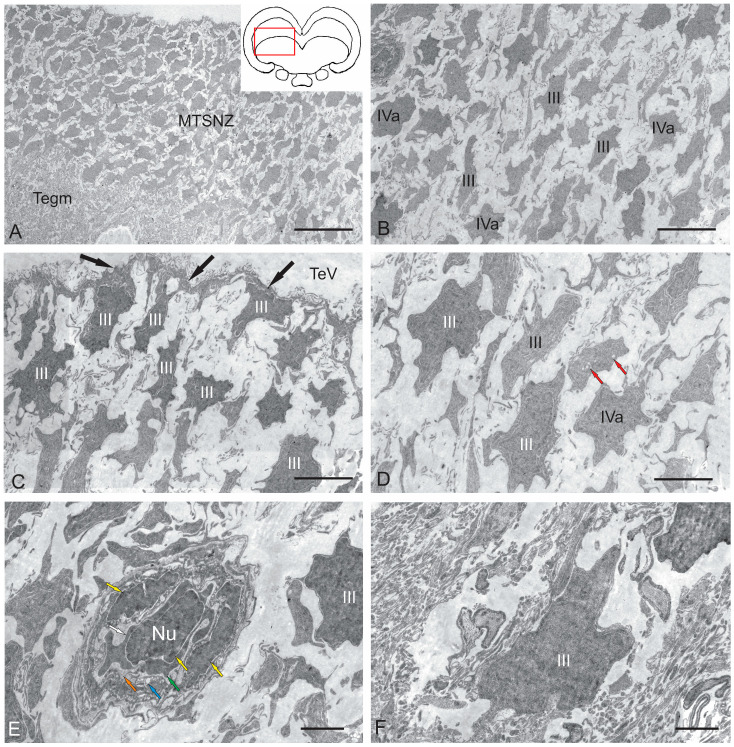
The ultrastructural organization of the nuclei of the tegmental region in juvenile chum salmon (Oncorhynchus keta) was examined using transmission electron microscopy (TEM). The dorsal tegmental nuclei (DTN), the nucleus of fasciculus longitudinalis medialis (NFLM), and the nucleus of the oculomotor nerve (NIII) were studied. The ultrastructural examination provided detailed ultrastructural characteristics of neurons forming the tegmental nuclei and showed neuro-glial relationships in them. Neurons of three size types with a high metabolic rate, characterized by the presence of numerous mitochondria, polyribosomes, Golgi apparatus, and cytoplasmic inclusions (vacuoles, lipid droplets, and dense bodies), were distinguished. It was found that large interneurons of the NFLM formed contacts with protoplasmic astrocytes. Excitatory synaptic structures were identified in the tegmentum and their detailed characteristic are provided for the first time. Microglia-like cells were found in the NIII. The ultrastructural characteristics of neurogenic zones of the tegmentum of juvenile chum salmon were also determined for the first time. In the neurogenic zones of the tegmentum, adult-type neural stem progenitor cells (aNSPCs) corresponding to cells of types III and IVa Danio rerio. In the neurogenic zones of the tegmentum, neuroepithelial-like cells (NECs) corresponding to cells previously described from the zebrafish cerebellum were found and characterized. In the tegmentum of juvenile chum salmon, patterns of paracrine neurosecretion were observed and their ultrastructural characteristics were recorded. Patterns of apoptosis in large neurons of the tegmentum were examined by TEM. Using immunohistochemical (IHC) labeling of the brain lipid-binding protein (BLBP) and aromatase B (AroB), patterns of their expression in the tegmentum of intact animals and in the post-traumatic period after acute injury to the medulla oblongata were characterized. The response to brainstem injury in chum salmon was found to activate multiple signaling pathways, which significantly increases the BLBP and AroB expression in various regions of the tegmentum and valvula cerebelli. However, post-traumatic patterns of BLBP and AroB localizations are not the same. In addition to a general increase in BLBP expression in the tegmental parenchyma, BLBP overexpression was observed in the rostro-lateral tegmental neurogenic zone (RLTNZ), while AroB expression in the RLTNZ was completely absent. Another difference was the peripheral overexpression of AroB and the formation of dense reactive clusters in the ventro-medial zone of the tegmentum. Thus, in the post-traumatic period, various pathways were activated whose components were putative candidates for inducers of the "astrocyte-like" response in the juvenile chum salmon brain that are similar to those present in the mammalian brain. In this case, BLBP acted as a factor enhancing the differentiation of both radial glia and neurons. Estradiol from AroB+ astrocytes exerted paracrine neuroprotective effects through the potential inhibition of inflammatory processes. These results indicate a new role for neuronal aromatization as a mechanism preventing the development of neuroinflammation. Moreover, our findings support the hypothesis that BLBP is a factor enhancing neuronal and glial differentiation in the post-traumatic period in the chum salmon brain.

Keywords: Oncorhynchus keta; aromatase B; brain lipid-binding protein; dorsal tegmental nucleus; nucleus of fasciculus longitudinalis medialis; nucleus of oculomotor nerve; tegmentum; transmission electron microscope.


Conflict of interest statement

The authors declare no conflict of interest.

Figures

Figure 1
Figure 1
Methylene blue-stained semi-thin sections showing the major nuclear structures of the tegmentum and the periventricular region in juvenile chum salmon, Oncorhynchus keta. (A) The tegmentum region containing the lateral periventricular zone (LPVZ) is shown in the red box and inset; the orange arrow indicates the vessel; lateral tegmental neurons are outlined by a red dotted square; dorsal tegmental neurons (DTN) are shown in the yellow box; the pictogram in the red box shows the area of interest. TeO—optic tectum; Tegm—tegmentum. (B) The medial tegmentum region (is shown in the brown box) containing the medial periventricular zone (MPVZ); black arrows in the red box probably indicate aNSPC; yellow arrows indicate neurons of the nucleus of the longitudinal medial fasciculus (NFLM). (C) An enlarged fragment of LPVZ (in red dotted oval). Scale: (AC) 100 µm.
Figure 2
Figure 2
Ultrastructural organization of nucleus of oculomotor nerve III in the juvenile chum salmon, Oncorhynchus keta. (A) Large interneurons (inI) are shown in light purple; smaller interneurons (inII) are highlighted in blue; nuclei of inI and inII are highlighted in lighter and darker shades, respectively; interneuron with the smallest soma size is designated as inIII; myelin fiber bundles are highlighted in orange; the inset in the black square shows a cross section of a myelin fiber; the microglia population is highlighted in yellow; a microgliocyte with a nucleus is indicated by the orange arrow, myelin fibers are shown by the yellow arrow. (B) Ultrastructural organization of inI; pictogram shows the area of NIII localization; the dotted line indicates dendrite (D); pink arrows indicate mitochondria; blue arrows indicate lipid droplets; green arrows indicate actin microfibrils; the orange arrow indicates a myelin fiber. (C) Ultrastructural organization of inI at higher magnification; the nucleus is highlighted in yellow; mitochondria are indicated by green arrows. (D) Ultrastructural organization of inI at higher magnification; nuclear boundaries (Nu) are indicated by the black dotted line; the heterochromatin fragment containing polyribosomes is outlined by the black rectangle; single polysomes are indicated by blue arrows; Golgi apparatus cisterns (AG) are indicated by red arrows; mitochondria are indicated by green arrows. Transmission electron microscopy. Scale: (A) 10 μm; (B) 2 μm; and (C,D) 1 μm.
Figure 3
Figure 3
Ultrastructural organization of nucleus of fasciculus longitudinalis medialis (NFLM) in juvenile chum salmon, Oncorhynchus keta. (A) Ipsilateral (right) part of NFLM, large inI, medium inII, and small inIII interneurons are highlighted in light blue; nuclei, in blue; synaptic terminals, in yellow; oligodendrocyte, in light purple; apoptotic cell, in light red; fibers, in orange. (B) Contralateral part of NFLM; lipid droplets are indicated by red arrows; nucleolus, by a black arrow; enlarged oligodendrocyte, in the purple rectangle; enlarged apoptotic cell, in the red rectangle; other designations are as in (A). (C) Enlarged fragment containing large type I interneurons in B; inI nuclei are highlighted in light orange; mitochondria in the synaptic terminal are indicated by light blue arrows; other designations are as in (B). (D) Ultrastructural organization of inI at higher magnification; nucleoli are indicated by white arrows; other designations are as in (C). (E) Ultrastructural organization of asymmetric synaptic terminal; tight junction zone is indicated by yellow arrowheads; presynaptic membrane, by red arrowheads; postsynaptic membrane, by green arrowheads; polyribosomes, by orange arrows; other designations are as in (D). (F) Ultrastructural organization of the presynaptic region at a higher magnification; neurofilaments are indicated by yellow arrows; rough endoplasmic reticulum cisterns with polyribosomes, by green arrows; other designations are as in (E). Transmission electron microscopy. Scale: (A,B) 10 μm; (C,D) 2 μm; and (E,F) 500 nm.
Figure 4
Figure 4
Ultrastructural organization of dorsal tegmental nucleus (DTN) in juvenile chum salmon, Oncorhynchus keta. (A) Large neuron with primary dendrites of DTN is highlighted in blue. (B) Large interneuron with lipid inclusions is highlighted in blue in parenchyma of the dorsomedial part of tegmentum; oligodendrocytes are highlighted in light red; astrocyte, in green; medium-sized interneuron inII is highlighted in yellow; and cross section of myelinated fiber, in orange. (C) Large primary interneuron (nucleus is highlighted in light blue) in contact with protoplasmic astrocytes (in green); a fragment of longitudinal myelinated fiber is outlined by a dotted line; other fragments are highlighted in orange. (D) An enlarged fragment containing neuroglial somato-somatic tight junctions (red triangular arrows) of a large interneuron and astrocytes (As, highlighted in green). (E) Protoplasmic type astrocytes (As) with short, branched processes ending with characteristic “astrocytic legs” (magenta arrows). (F) A fragment of a neuron (in blue) in contact with the “astrocytic legs” (indicated by magenta arrows) of a protoplasmic astrocyte (in green); mitochondria are indicated by yellow arrows. (G) Interneurons of second type inII (nuclei are highlighted in yellow) and third type inIII; nucleoli are indicated by a black arrow; in DTN, neurons in a state of apoptosis and apoptotic body are highlighted in orange; an enlarged fragment is shown in the black rectangle in (G). (H) Patterns of apoptosis of large neuron and apoptotic body (highlighted in orange) and paracrine neurosecretion (neurosecretory cell is indicated in light purple); neurosecretory granules are outlined by a dotted line. Transmission electron microscopy. Scale: (AC,G) 10 µm; (D) 2 µm; (E,F) 1 µm; and (H) 5 µm.
Figure 5
Figure 5
Ultrastructural features of neuro–glial relationships in DTN of juvenile chum salmon, Oncorhynchus keta. (A) Large inI interneurons (cytoplasm is highlighted in yellow, in red dotted oval) in contact with protoplasmic astroglia (indicated by green arrows); myelinated fibers are indicated by black arrows; oligodendrocyte, by a magenta arrow. (B) Ultrastructural organization of inI interneuron shown in (A) (in a black oval) at a higher magnification; lipid droplets are indicated by orange arrows; Nu—nucleus; fragments of myelinated fibers are indicated by black arrows. (C) Enlarged fragment shown in (B) (outlined by black diamond); the “astrocytic legs” are indicated by a blue arrow; yellow arrowhead indicates the zone of tight contact between the astrocyte and inI; red arrow indicates the area of extended contact. (D) Enlarged fragment in (C) showing the area of desmosome-like structures (magenta triangular arrows) in the zone of tight neuroglial junctions and neurofilaments (indicated by yellow arrow). (E) DTN neurons of deeper parenchymatous localization (cytoplasm highlighted in light orange; nuclei, in yellow) contacting astrocytic glia (indicated by magenta arrows); a fragment of astrocyte is indicated by a blue arrow; myelin fibers, by black arrows. (F) An enlarged fragment in E showing neuro–glial contacts (magenta triangle arrows); small mitochondria are indicated by yellow arrows; elongated mitochondria, by orange arrows; lipid droplets, by pink arrows. Transmission electron microscopy. Scale: (A) 20 μm; (B) 5 μm; (C,D) 1 μm; (E) 10 μm; and (F) 2 μm.
Figure 6
Figure 6
Semi-thin sections stained with methylene blue showing the tegmental and tectal neurogenic zones in the latero-caudal region of torus semicircularis in juvenile chum salmon, Oncorhynchus keta. The red rectangle on the pictograms shows the brain regions in the micrographs. (A) Rostral lateral tegmental neurogenic zone (RLTNZ); the basal border is indicated by the black dotted line; TeV—tectal ventricle; an enlarged fragment is in the red dotted inset. (B) Neurogenic zone of torus semicircularis (TS), medial part (MTSNZ). (C) Lateral neurogenic zone of torus semicircularis (LTSNZ). (D) Enlarged fragment of LTSNZ. (E) Caudal segment of the lateral tegmental zone CLTNZ (in black rectangle). (F) Enlarged fragment of CLTNZ; vessels are indicated by red arrows. Scale: (A,D,F) 50 µm and (B,C,E) 100 µm.
Figure 7
Figure 7
Ultrastructural organization of the rostral lateral tegmental neurogenic zone (RLTNZ) in juvenile chum salmon, Oncorhynchus keta. (A) Lateral part of RLTNZ (shown in the red rectangle in the pictogram); dorsal ependymal lamina (DEL) consisting of a pseudo-monolayer of cuboidal ependymal cells (highlighted in pink); type III cells identified in RLTNZ (highlighted in green); divided cells are highlighted in pink. (B) RLTNZ of tegmentum (Tegm) at the border with tectal marginal zone TMZ; elongated ependymal cells are highlighted in pink; type III cells are indicated by red arrows; type IV cells, by blue arrows; neuroepithelium-like cell is in the red rectangle; cytoplasm is highlighted in orange; apical contact zone is indicated by the asterisk. (C) Medial RLTNZ containing type III and IVa cells, ependymal cells, and neuroepithelial-like cells in mitosis; apical NEC contacts superficial layer aNSPCs (in green), as in (B). (D) Deep RLTNZ containing aNSPCs (type III and IVa cells). (E) Morphological heterogeneity of type III and IVa cells from medial RLTNZ at a higher magnification. (F) Light nucleus and heterochromatin in type IVa cells and highly irregular dark nucleus of type III cells from lateral RLTNZ at a higher magnification. Transmission electron microscopy. Scale: (A,D) 5 μm; (B,C) 10 μm; and (E,F) 2 μm.
Figure 8
Figure 8
Ultrastructural organization of the neurogenic zone of torus semicircularis (TSNZ, red box in pictogram) in juvenile chum salmon, Oncorhynchus keta. (A) aNSPCs in the medial part of the neurogenic zone of torus semicircularis (MTSNZ); pictogram shows the area of study. (B) Cells of types III and IVa in the ventral part of MTSNZ at a higher magnification. (C) Cells of type III in the dorsal part of MTSNZ contacting apical membrane (indicated by black arrow). (D) Cells of types III and IVa in TSNZ with large nuclei of irregular shape and minimal cytoplasm containing lipid droplets (red arrows). (E) Microvessel in TSNZ with endothelial cells (yellow arrows) localized in its wall; in the central part, an immature form of a macrophage (white arrow) containing a nucleus (Nu) and branched cytoplasmic processes (green arrow), lipid inclusions (blue arrow), and endothelial cell cytoplasm (orange arrow). (F) Type III cells in TSNZ at a higher magnification, in contact with the intercellular substance. Transmission electron microscopy. Scale: (A) 20 μm; (B) 10 μm; (C,D) 5 μm; and (E,F) 2 μm.
Figure 9
Figure 9
Ultrastructural organization of latero-caudal tegmental neurogenic zone (CLTNZ). (A) Cellular structure of CLTNZ (pictogram shows the area of study); cells of types III and Iva; dividing cells are indicated by the dotted line. (B) Morphological phenotypes of cells of types III (highlighted in green) and IVa (in red); cytoplasm of cells is highlighted in lighter tones; the nucleus is highlighted in a more saturated tone. (C) Caudal part of CLTNZ containing type III cells with nuclei having irregular and elongated morphologies (indicated by red arrows) and more ventrally localized cells of type IVa (indicated by green arrows). (D) A fragment shown in (C) (outlined by red rectangle) at a higher magnification. (E) Medial part of CLTNZ containing type III and IVa cells localized perpendicular to intertectal ventricle (indicated by green arrows). (F) Patterns of type III cell proliferation (daughter cell shown in red) in the apical layers of CLTNZ. Transmission electron microscopy. Scale: (A,C,E) 10 μm and (B,D,F) 2 μm.
Figure 10
Figure 10
Immunohistochemical labeling of brain lipid-binding protein (BLBP) in the mesencephalic tegmentum of intact juvenile chum salmon, Oncorhynchus keta. (A) BLBP distribution in the rostral part of tegmentum of intact juveniles; in the periventricular region of RLTNZ, clusters of BLBP+ cells are in the red rectangle; SVZ—subventricular zone; PZ—parenchymatous zone. (B) In the valvula cerebelli, BLBP expression was detected in small type 1 cells (red arrows) located in the molecular layer (ML); enlarged fragment is located in the red rectangle. (C) At the rostro-medial level, projections of the nucleus of the III nerve, BLBP-negative interneurons of the III nerve (blue arrows), clusters of small cells (in black rectangles), and cells migrating along vessels (yellow arrows) are shown; BLBP+ cells are in the red rectangle. (D) The caudo-lateral level of the projection of the nucleus III nerve; designations are as in (C). (E) In the region of torus semicircularis (TS), single BLBP+ cells (red arrows) and large and dense BLBP-immunonegative clusters (in red dotted ovals) are shown. (F) In the ventral part of TS, single BLBP+ cells (in red rectangles) are shown. Scale: (A,C,E) 10 µm and (B,D,F) 2 µm.
Figure 11
Figure 11
Immunohistochemical labeling of BLBP in the mesencephalic tegmentum of juvenile chum salmon, Oncorhynchus keta, with acute injury of medulla oblongata. (A) In the rostro-lateral part of the tegmentum, a cluster of small undifferentiated BLBP cells (outlined by dotted line), elongated BLBP+ cells (yellow arrows) along small vessels, and single parenchymatous BLBP+ cells (red arrow) are shown. (B) In the medial tegmentum, the migration of BLBP+ oval cells (red arrows) along vessels (shown in insets I and II in red rectangles) and elongated BLBP+ cells (yellow arrows) are shown. (C) In the valvula cerebelli, BLBP+ Bergmann glia fibers (yellow arrow) in the dorsal part of molecular layer (ML) are shown; the dotted red oval outlines an aggregation of BLBP+ oval cells; single BLBP+ cells are indicated by red arrows. (D) At a higher magnification, terminal branches of BLBP+ Bergmann glia (blue arrows) and BLBP+ cells (white arrow) migrating along Bergmann glia (black inset) are shown. Scale: (A,C) 10 μm and (B,D) 2 μm.
Figure 12
Figure 12
Immunohistochemical labeling of BLBP in radial glia (RG) of the tegmentum in juvenile chum salmon, Oncorhynchus keta, with acute injury of medulla oblongata. (A) BLBP immunolabeling in RG fibers (white arrows) at the NFLM level; blue arrows indicate BLBP+ cells in the tegmentum parenchyma. (B) In the area of torus semicircularis (TS), thick guides are indicated by red arrows; BLBP+ RG fibers are indicated by white arrows; intensely labeled BLBP+ cells (black arrow), parenchymal weakly labeled BLBP+ cells are indicated by blue arrows; multicellular complexes with BLBP+ and BLBP− cells are shown in the black rectangle; and terminal branches of BLBP+ RG fibers are shown in red rectangles. (C) In the area of the lateral torus (LT), migrating BLBP+ cells are indicated by red arrows; other designations are as in (A). (D) In the dorsal tegmentum, moderate BLBP expression in large DTN neurons are indicated by yellow arrows; migrating and parenchymal BLBP+ cells are indicated by red arrows; and BLBP+ RG fibers are indicated by the white arrow. (E) In the caudal tegmentum, migrating and parenchymatous BLBP+ cells are indicated by red arrows. (F) In the ventro-lateral tegmentum, the designations are as in (E). Scale: (AF) 100 μm.
Figure 13
Figure 13
Immunohistochemical labeling of BLBP in the neurogenic zones of the tegmentum in juvenile chum salmon, Oncorhynchus keta, with acute injury of medulla oblongata. (A) In the RLTNZ, BLBP+ RG fibers are shown in the red rectangle; single immunolabeled RG fibers are indicated by white arrows; BLBP+ cells in the parenchyma are indicated by blue arrows; pattern of BLBP+ cell migration along RG is indicated by the red arrow; the black rectangle outlines proximal fragments of BLBP+ RG emerging from RLTNZ. (B) In the lateral tegmentum, in the red square, a fragment containing BLBP+ cells is indicated by blue arrows and fibers are indicated by white arrows. (C) An enlarged dorsal fragment is shown in (A); yellow arrows indicate BLBP+ in NSPCs in the RLTNZ. (D) An enlarged dorsomedial fragment in (A) containing BLBP+ RG (yellow arrows) and BLBP+ cells migrating along RG (red arrows); the red rectangle outlines the terminal branches of BLBP+ fibers; the white arrow indicates a thin BLBP+ branch of RG fiber. Scale: (A,B) 200 μm and (C,D) 100 μm.
Figure 14
Figure 14
Immunohistochemical labeling of AroB in the tegmentum of intact juvenile chum salmon, Oncorhynchus keta. (A) In the SVZ in the dorsomedial region (red inset), dorsal parenchymal regions of PZ are shown in the black inset, AroB+ cells are indicated by red arrows, and migration patterns of immunonegative cells are indicated by yellow arrows. (B) In the dorsolateral region of tegmentum, immunonegative neurons are indicated by blue arrows and the migration of immunonegative cells is indicated by yellow arrows. (C) In the rostral part of TS, the designations are as in (A). (D) in NIII, AroB expression in cells of the medio-basal region is shown in the black rectangle; other designations are as in (A). (E) In the caudal part of TS, AroB expression in granule-like cells of SVZ is shown in the red rectangles; other designations are as in (A). (F) In the ventrolateral part of isthmus, AroB+ cells are indicated by red arrows and single immunonegative neurogenic niches are shown in the red dotted oval. Scale: (AF) 100 μm.
Figure 15
Figure 15
Immunohistochemical labeling of AroB in the tegmentum of juvenile chum salmon, Oncorhynchus keta, at 3 days after traumatic injury to medulla oblongata. (A) In the rostral isthmus (Is), AroB in populations of migrating cells from the basal and basolateral areas of the brain are outlined by red dotted rectangles 1, 2, and 3; in the trigeminal ganglion (GV) and pial membrane large, moderately AroB+ labeled cells are indicated by yellow arrows; small, intensely AroB+ labeled cells are indicated by red arrows; mixed clusters of intensely AroB+ labeled large and small cells are shown in the red dotted square; in the basal and basolateral part of isthmus, AroB+ fibers RG are indicated by orange arrows; in the PZ of isthmus, intensely AroB+ labeled medium-sized cells are indicated by green arrows; in PVZ, small intensely AroB+ cells are shown in the red square; AroB+ cells in the granular layer of cerebellar valve VL are shown in the black square. (B) Enlarged fragment is shown in the red dashed rectangle 1; AroB+ cells (red arrows); AroB-negative cells (blue arrows); AroB+ RG fibers (orange arrows). (C) In the ventro-lateral regions of the tegmentum, dense patterns of migration of intensely AroB+ labeled cells are shown in the red inset with AroB+ RG fibers; RG end feet converging on immunonegative cells are indicated by orange arrows; other designations are as in (B). (D) In the ventro-medial part of tegmentum, extended fragments of RG fibers with AroB+ and AroB− cells migrating along them are shown; clusters of AroB− cells are shown in the red dotted circle; other designations are as in (B). (E) In the baso-medial part of tegmentum, dense clusters of small intensely labeled AroB+ cells are shown in red dotted rectangle; other designations are as in (B). F—Secondary neurogenic niches in the outer marginal zone of tegmentum, on the border with the pial membrane are shown in in red dotted rectangle; other designations are as in (B). Scale: (A) 200 μm; (BE) 100 μm; and (F) 50 μm.
Figure 16
Figure 16
Immunohistochemical labeling of AroB in the caudal isthmus of juvenile chum salmon, Oncorhynchus keta, at 3 days after traumatic injury to medulla oblongata. (A) General view of isthmus with immunolabeling of AroB+ cells in secondary post-traumatic niches (red dotted rectangle); a linear cluster of AroB+ cells along the lateral wall of hypothalamic ventricle (in red rectangle); patterns of AroB+ cell migration along RG (in black rectangles); AroB+ cells (red arrows); AroB+ RG fibers (orange arrows); AroB-negative neurons of DTN (green arrow). (B) Enlarged fragment with secondary neurogenic niches containing AroB+ cells; designations as in (A). (C) Enlarged fragment along infundibulum with AroB+ cells in the pereinfundibular area (red arrows) and horizontal clusters of AroB+ cells (in red rectangles). (D) On the ipsilateral side of AroB+ RG (orange arrows), end apparatuses and fragments of fibers in the ventrolateral isthmus are shown. (E) On the contralateral side, single AroB+ cells are indicated by red arrows. (F)—In the ventro-medial part of the tegmentum (ipsilateral side), patterns of AroB+ RG and their interactions with migrating cells are indicated by orange arrows. Scale: (A) 200 μm; (BE) 100 μm; and (F) 50 μm.
Figure 17
Figure 17
Immunohistochemical labeling of AroB in valvula cerebelli of juvenile chum salmon, Oncorhynchus keta, at 3 days after traumatic injury to the medulla oblongata. (A) Caudal projection of valvula cerebelli; migrating AroB+ cells along radial fibers of Bergmann glia (red arrows). (B) Mass patterns of AroB+ cell migration in the rostral part of valvula cerebelli from the molecular layer (ML); large clusters (blue arrow) of small immunonegative cells (outlined by black dotted line). (C) Central vascular complex (Ves) with superficial clusters of AroB+ cells (in red dotted ovals); immunonegative vascular endothelial cells (blue cells); AroB+ cells (red arrows). (D) Vascular structures with clusters of migrating AroB+ cells localized along them (in red rectangles); other designations are as in (C). (E) Patterns of AroB+ cell migration and fragments of AroB+ Bergmann glia in the peripheral zones of valvula cerebelli (VC) in the ML; designations are as in (C). Scale: (A,B,E) 100 μm and (C,D) 50 μm.
Figure 18
Figure 18
Quantitative proportions of BLBP+ cells in different tegmental areas of juvenile chum salmon, Oncorhynchus keta, at control and 3 days after traumatic injury to the medulla oblongata (M ± SD), where M is the mean and SD is the standard deviation (n = 5 in each group; ** p ≤ 0.01 and *** p ≤ 0.001—significant differences vs. control groups). Student–Newman–Keuls test.
Figure 19
Figure 19
Quantitative proportions of Aro B+ cells in different tegmental areas of juvenile chum salmon, Oncorhynchus keta, at control and 3 days after traumatic injury to the medulla oblongata (M ± SD), where M is the mean and SD is the standard deviation (n = 5 in each group; ** p ≤ 0.01 and *** p ≤ 0.001—significant differences vs. control groups). Student–Newman–Keuls test.
Figure 20
Figure 20
Negative controls (representative sections) in the tegmentum of juvenile chum salmon, Oncorhynchus keta. (A) IHC labeling of BLBP in the rostro-medial tegmentum. (B) IHC labeing of aromatase B in the rostro-lateral tegmentum. The red inset in the pictogram shows the respective zone in the micrograph. Scale bar: 100 μm.

Similar articles

References

    1. Lindsey B.W., Darabie A., Tropepe V. The cellular composition of neurogenic periventricular zones in the adult zebrafish forebrain. J. Comp. Neurol. 2012;520:2275–2316. doi: 10.1002/cne.23065. - DOI - PubMed
    1. Cheng R.K., Jesuthasan S.J., Penney T.B. Zebrafish forebrain and temporal conditioning. Philos. Trans. R. Soc. B Biol. Sci. 2014;369:20120462. doi: 10.1098/rstb.2012.0462. - DOI - PMC - PubMed
    1. Babchenko V.Y., Belova A.S., Bashirzade A.A., Peskov A.V., Giniatullina A.N., Shchegolev B.F. Models of Traumatic Brain Injury in Zebrafish (Danio rerio) Ross. Fiziol. Zhurnal Im. IM Sechenova. 2021;107:1059–1076. doi: 10.1007/s11055-022-01254-y. - DOI
    1. Kaslin J., Ganz J., Brand M. Stem cells in the adult zebrafish cerebellum: Initiation and maintenance of a novel stem cell niche. J. Neurosci. 2009;29:6142–6153. doi: 10.1523/JNEUROSCI.0072-09.2009. - DOI - PMC - PubMed
    1. Carletti B., Rossi F. Neurogenesis in the cerebellum. Neuroscientist. 2008;14:91–100. doi: 10.1177/1073858407304629. - DOI - PubMed

LinkOut - more resources