. 2025 Jan 15;26(2):693.
doi: 10.3390/ijms26020693.

Olaparib Combined with DDR Inhibitors Effectively Prevents EMT and Affects miRNA Regulation in TP53-Mutated Epithelial Ovarian Cancer Cell Lines

Affiliations

Olaparib Combined with DDR Inhibitors Effectively Prevents EMT and Affects miRNA Regulation in TP53-Mutated Epithelial Ovarian Cancer Cell Lines

Patrycja Gralewska et al. Int J Mol Sci. .

Abstract

Epithelial ovarian cancer (EOC) remains a leading cause of gynecologic cancer mortality. Despite advances in treatment, metastatic progression and resistance to standard therapies significantly worsen patient outcomes. Epithelial-mesenchymal transition (EMT) is a critical process in metastasis, enabling cancer cells to gain invasive and migratory capabilities, often driven by changing miRNA expression involved in the regulation of pathological processes like drug resistance. Targeted therapies like PARP inhibitors (PARPi) have improved outcomes, particularly in BRCA-mutated and DNA repair-deficient tumors; however, resistance and limited efficacy in advanced stages remain challenges. Recent studies highlight the potential synergy of PARPi with DNA damage response (DDR) inhibitors, such as ATR and CHK1 inhibitors, which disrupt cancer cell survival pathways under stress. This study investigated the combined effects of olaparib with ATR and CHK1 inhibitors (ATRi and CHK1i) on migration, invasion, and EMT-related protein expression and miRNA expression in ovarian cancer cell lines OV-90 and SKOV-3. The results demonstrated enhanced cytotoxicity, inhibition of migration and invasion, and modulation of miRNAs linked to metastasis. These findings suggest that combination therapies targeting DNA repair and cell cycle pathways may offer a novel, more effective approach to managing advanced EOC and reducing metastatic spread.

Keywords: DDR inhibitors; EMT; PARPi; miRNA; ovarian cancer.


Conflict of interest statement

The authors declare no conflicts of interest.

Figures

Figure 1
Figure 1
Olaparib in combination with CHK1i or ATRi decreased the viability of OC cells more effectively than PARPi alone. (A) Cell viability after treatment with O (PARPi), A (ATRi), or C (CHK1i) in SKOV-3 and OV-90 cell lines, at increasing concentrations for 5 days, was assessed by the MTT assay (* p < 0.05). (B) IC50 values of the tested inhibitors after the 5-day treatment. (C) The effect of olaparib combinations with A or C at different ratios, after 5 days of treatment, was evaluated by the MTT assay. * Statistically significant differences between cells incubated with the compound compared with the control cells (p < 0.05). + Statistically significant changes between cells incubated with O and combination treatment (O+A; O+C) (p < 0.05). # Statistically significant differences between the cells incubated with A or C and combination treatment (O+A; O+C) (p < 0.05).
Figure 2
Figure 2
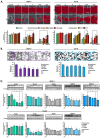
Olaparib combined with ATRi or CHK1i synergizes to affect the migration and invasion of SKOV-3 and OV-90 cells. (A) Representative images of the cells from the wound healing assay, acquired immediately after scratching (0 h) and 48 h (SKOV-3) or 96 h (OV-90) later, examined under an inverted phase-contrast microscope (Olympus IX70, Japan) (scale bar = 100 μm). Cellular migratory ability is presented as the percentage of wound closure. Each bar represents mean ± SD. * Statistically significant differences between cells incubated with the inhibitor’s treated cells and control cells (p < 0.05). + Statistically significant changes between cells incubated with O and combination treatment (O+A; O+C) (p < 0.05). # Statistically significant differences between the cells incubated with A or C and combination treatment (O+A; O+C) (p < 0.05). (B) Representative images of invading cells after incubation with the inhibitor compounds for 48 h. The scale bar represents 100 μm. Invasive cells were stained with crystal violet and subsequently extracted, and the absorbance values were measured. The percentage of migrated cells was estimated using the same formula as MTT. The results are expressed as mean ± SD (* p < 0.05). (C) Representative Western blot images and relative expression of MMP2, MMP9, E-cadherin, N-cadherin, and Snail in SKOV-3 and OV-90 cells. * indicates statistically significant differences between cells incubated with the compound compared with control cells (p < 0.05); + indicates statistically significant differences between cells incubated with O alone and the combination treatments (O+A; O+C) (p < 0.05).
Figure 3
Figure 3
Expression of miRNAs in response to tested inhibitors in SKOV-3 and OV-90 cell lines relative to untreated controls. Cells were treated with O, A, C, or their combinations for 48 h. Levels of miRNAs were determined via real-time qPCR and expressed as means of logarithmic fold change ± SD. (A) Volcano plots for miRNAs. Significantly down- and upregulated miRNAs are highlighted with blue and red dots, respectively (absolute fold changes in expression ≥ 1.5 and p < 0.05). (B) Heatmaps for miRNA expression. Significantly (p < 0.05) down- and upregulated miRNAs (absolute fold change ≥ 1.5) are highlighted with blue and red triangles, respectively. Non-informative miRNAs with raw CT values ≥ 33 in ≥75% of control samples (marked as black rectangles) were excluded from the analyses. Hierarchical clustering via heatmaps with the ClustVis web tool was performed using correlation distance and average linkage based on miRNA expression profiles. In SKOV-3 cells, the dashed line shows clustering of O and C groups with an A group. (C) Statistical analysis for the expression of significantly dysregulated miRNA assessed with ordinary one-way ANOVA followed by Šídák multiple comparison tests (normally distributed data with homogenous variance) or Kruskal–Wallis followed by Dunn’s multiple comparison test (non-normally distributed data): * p < 0.05, ** p < 0.01, *** p < 0.001 (treatment vs. control); + p < 0.05, ++ p < 0.01, +++ p < 0.001, ++++ p < 0.0001 (O vs. combination with A or C); # p < 0.05, ### p < 0.001 (A or C vs. respective combinations with O). The red and blue areas indicate fold-change values for up- and downregulated miRNAs (absolute log2 of fold change ≥ 0.585), respectively.
Figure 4
Figure 4
Network-based analyses for target genes of dysregulated miRNAs in response to olaparib combinations with ATRi or CHK1i in SKOV-3 and OV-90 cell lines. (A) The miRNA–mRNA regulatory network with PPIs highlighting genes associated with selected enriched Reactome terms in different colors as indicated. The remaining target genes are represented by pink circular nodes. (B) A bubble blot showing selected Reactome and GO:BP terms from the functional enrichment analysis. The terms were ranked based on the target gene hit number and significance level (adjusted p-value).

References

    1. Torre L.A., Trabert B., DeSantis C.E., Miller K.D., Samimi G., Runowicz C.D., Gaudet M.M., Jemal A., Siegel R.L. Ovarian cancer statistics, 2018. CA A Cancer J. Clin. 2018;68:284–296. doi: 10.3322/caac.21456. - DOI - PMC - PubMed
    1. Matulonis U.A., Sood A.K., Fallowfield L., Howitt B.E., Sehouli J., Karlan B.Y. Ovarian cancer. Nat. Rev. Dis. Primers. 2016;2:16061. doi: 10.1038/nrdp.2016.61. - DOI - PMC - PubMed
    1. Cummings M., Nicolais O., Shahin M. Surgery in Advanced Ovary Cancer: Primary versus Interval Cytoreduction. Diagnostics. 2022;12:988. doi: 10.3390/diagnostics12040988. - DOI - PMC - PubMed
    1. Lungchukiet P., Sun Y., Kasiappan R., Quarni W., Nicosia S.V., Zhang X., Bai W. Suppression of epithelial ovarian cancer invasion into the omentum by 1alpha,25-dihydroxyvitamin D3 and its receptor. J. Steroid Biochem. Mol. Biol. 2015;148:138–147. doi: 10.1016/j.jsbmb.2014.11.005. - DOI - PMC - PubMed
    1. Riggio A.I., Varley K.E., Welm A.L. The lingering mysteries of metastatic recurrence in breast cancer. Br. J. Cancer. 2021;124:13–26. doi: 10.1038/s41416-020-01161-4. - DOI - PMC - PubMed

MeSH terms