

The Diurnal Variation in Mitochondrial Gene in Human Type 2 Diabetic Mesenchymal Stem Cell Grafts
- PMID: 39859433
- PMCID: PMC11765740
- DOI: 10.3390/ijms26020719
The Diurnal Variation in Mitochondrial Gene in Human Type 2 Diabetic Mesenchymal Stem Cell Grafts
Abstract
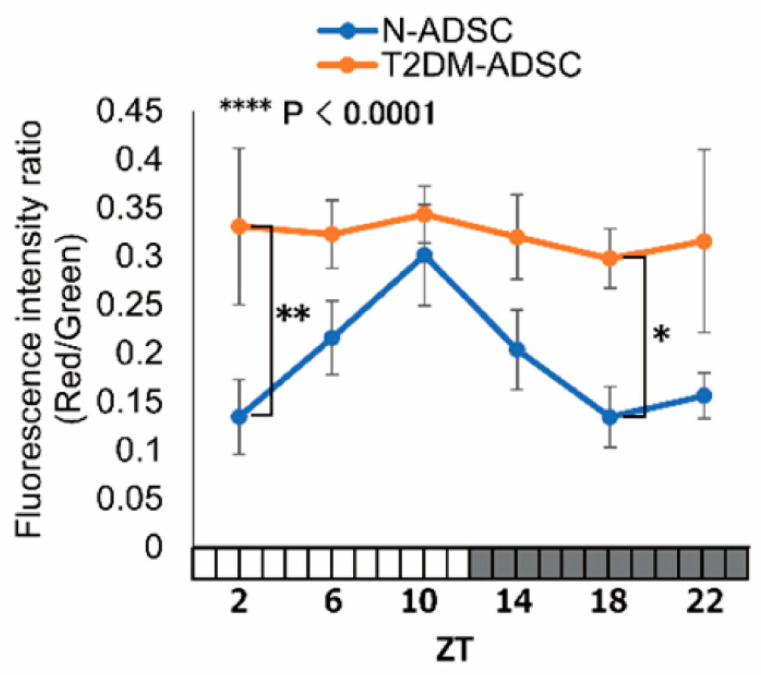
The application of regenerative therapy through stem cell transplantation has emerged as a promising avenue for the treatment of diabetes mellitus (DM). Transplanted tissue homeostasis is affected by disturbances in the clock genes of stem cells. The aim of this study is to investigate the diurnal variation in mitochondrial genes and function after transplantation of adipose-derived mesenchymal stem cells (T2DM-ADSCs) from type 2 diabetic patients into immunodeficient mice. Diurnal variation in mitochondrial genes was assessed by next-generation sequencing. As a result, the diurnal variation in mitochondrial genes showing troughs at ZT10 and ZT22 was observed in the group transplanted with adipose-derived mesenchymal stem cells derived from healthy individuals (N-ADSC). On the other hand, in the group transplanted with T2DM-ADSCs, diurnal variation indicative of troughs was observed at ZT18, with a large phase and amplitude deviation between the two groups. To evaluate the diurnal variation in mitochondrial function, we quantified mitochondrial DNA copy number using the Human mtDNA Monitoring Primer Set, measured mitochondrial membrane potential using JC-1, and evaluated mitophagy staining. The results showed a diurnal variation in mitochondrial DNA copy number, mitophagy, mitochondrial membrane potential, and NF-kB signaling in the N-ADSC transplant group. In contrast, no diurnal variation was observed in T2DM-ADSC transplants. The diurnal variation in mitochondrial function revealed in this study may be a new marker for the efficiency of T2DM-ADSC transplantation.
Keywords: NF-kB; diurnal variation; mesenchymal stem cells (MSC); mitochondria; mitophagy; type 2 diabetes mellitus.
Conflict of interest statement
The authors indicate no potential conflicts of interest in this paper.
Figures


Similar articles
-
Circadian Rhythms of Clock Genes After Transplantation of Mesenchymal Stem Cells with Type 2 Diabetes Mellitus.Int J Mol Sci. 2024 Dec 6;25(23):13145. doi: 10.3390/ijms252313145. Int J Mol Sci. 2024. PMID: 39684854 Free PMC article.
-
Netrin-1 improves adipose-derived stem cell proliferation, migration, and treatment effect in type 2 diabetic mice with sciatic denervation.Stem Cell Res Ther. 2018 Oct 25;9(1):285. doi: 10.1186/s13287-018-1020-0. Stem Cell Res Ther. 2018. PMID: 30359296 Free PMC article.
-
Treatment with adipose tissue-derived mesenchymal stem cells exerts anti-diabetic effects, improves long-term complications, and attenuates inflammation in type 2 diabetic rats.Stem Cell Res Ther. 2019 Nov 20;10(1):333. doi: 10.1186/s13287-019-1474-8. Stem Cell Res Ther. 2019. PMID: 31747961 Free PMC article.
-
Mesenchymal stem cell therapy targeting mitochondrial dysfunction in acute kidney injury.J Transl Med. 2019 May 2;17(1):142. doi: 10.1186/s12967-019-1893-4. J Transl Med. 2019. PMID: 31046805 Free PMC article. Review.
-
Enhancing the therapeutic efficacy of mesenchymal stem cell transplantation in diabetes: Amelioration of mitochondrial dysfunction-induced senescence.Biomed Pharmacother. 2023 Dec;168:115759. doi: 10.1016/j.biopha.2023.115759. Epub 2023 Oct 20. Biomed Pharmacother. 2023. PMID: 37865993 Review.
References
-
- Neufeld-Cohen A., Robles M.S., Aviram R., Manella G., Adamovich Y., Ladeuix B., Nir D., Rousso-Noori L., Kuperman Y., Golik M., et al. Circadian Control of Oscillations in Mitochondrial Rate-Limiting Enzymes and Nutrient Utilization by PERIOD Proteins. Proc. Natl. Acad. Sci. USA. 2016;113:E1673–E1682. doi: 10.1073/pnas.1519650113. - DOI - PMC - PubMed
MeSH terms
Substances
Grants and funding
LinkOut - more resources
Full Text Sources
Medical
Research Materials
