. 2025 Jan 19;26(2):819.
doi: 10.3390/ijms26020819.

A Study on Potential Sources of Perineuronal Net-Associated Sema3A in Cerebellar Nuclei Reveals Toxicity of Non-Invasive AAV-Mediated Cre Expression in the Central Nervous System

Affiliations

A Study on Potential Sources of Perineuronal Net-Associated Sema3A in Cerebellar Nuclei Reveals Toxicity of Non-Invasive AAV-Mediated Cre Expression in the Central Nervous System

Geoffrey-Alexander Gimenez et al. Int J Mol Sci. .

Abstract

Semaphorin 3A (Sema3A) is an axon guidance molecule, which is also abundant in the adult central nervous system (CNS), particularly in perineuronal nets (PNNs). PNNs are extracellular matrix structures that restrict plasticity. The cellular sources of Sema3A in PNNs are unknown. Most Sema3A-bearing neurons do not express Sema3A mRNA, suggesting that Sema3A may be released from other neurons. Another potential source of Sema3A is the choroid plexus. To identify sources of PNN-associated Sema3A, we focused on the cerebellar nuclei, which contain Sema3A+ PNNs. Cerebellar nuclei neurons receive prominent input from Purkinje cells (PCs), which express high levels of Sema3A mRNA. By using a non-invasive viral vector approach, we overexpressed Cre in PCs, the choroid plexus, or throughout the CNS of Sema3Afl/fl mice. Knocking out Sema3A in PCs or the choroid plexus was not sufficient to decrease the amount of PNN-associated Sema3A. Alternatively, knocking out Sema3A throughout the CNS induced a decrease in PNN-associated Sema3A. However, motor deficits, microgliosis, and neurodegeneration were observed, which were due to Cre toxicity. Our study represents the first attempt to unravel cellular sources of PNN-associated Sema3A and shows that non-invasive viral-mediated Cre expression throughout the CNS could lead to toxicity, complicating the interpretation of Cre-mediated Sema3A knock-out.

Keywords: AAV-PHP.eB; Cre; Purkinje cells; Semaphorin 3A; cerebellar nuclei; choroid plexus; perineuronal nets; toxicity.


Conflict of interest statement

The authors declare no conflicts of interest.

Figures
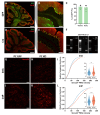
Figure 1
Figure 1
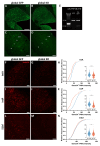
Knocking out Sema3A in PCs does not induce a decrease in Sema3A content in PNNs around cerebellar nuclei neurons. (AE) Strong GFP (A,B) or Cre expression (D,E) is detected in the majority of PCs after intravenous injection in Sema3Afl/fl mice with AAV-PHP.eB-L7-GFP or Cre. (C) Quantification of the percentage of PCs expressing GFP in the vermis and in the cerebellar hemispheres (N = 3 mice, each mouse is represented by a shape). (F) PCR for Sema3A showing a band of 1.6 kb, which corresponds to the intact Sema3A gene, in PCs of Sema3Afl/fl mice injected with AAV-PHP.eB-L7-GFP, -Cre, or -CreGFP and a band of 0.5 kb, corresponding to the excised Sema3A gene, in the Cre conditions. (GL) Sema3A intensity levels are increased in the IntA (GI) and IntP (JL) of PC KO mice when compared to PC GFP mice. (I,L) Cumulative frequency and violin plots of the intensity of individual Sema3A+ PNNs in the IntA and IntP of PC GFP mice (blue) and PC KO mice (red) (IntA, PC GFP: n = 651, PC KO: n = 457; IntP, PC GFP: n = 811, PC KO: n = 529). The median is represented by a black line. Scale bar: (A,D): 400 µm; (B,E): 100 µm; (G,H,J,K): 40 µm. ** p < 0.01, **** p < 0.0001.
Figure 2
Figure 2
Knocking-out Sema3A in the ChP does not induce a decrease in Sema3A content in PNNs around cerebellar nuclei neurons. (A) Immunostaining reveals Sema3A expression in the ChP. (B) GFP+ cells in the ChP following injection of AAV5-CAG-GFP in the lateral ventricle. Several ChP cells express Sema3A. (C,D) Around 60% of Sema3A+ cells in the ChP express GFP (C) and around 90% of GFP+ cells are Sema3A+ (N = 3) (D) when mice are injected with AAV5-CAG-GFP. (EJ) Examples of the specific transduction of the ChP in the lateral ventricle (E) and the IV ventricle (H) following AAV5-CAG-GFP injection. The hemi-forebrain in coronal slice (E) and the cerebellum in sagittal slice (H) is outlined in dashed lines. (F,G,I,J) High magnification pictures showing GFP (F,I) or Cre expression (G,J) in the lateral ventricle (F,G) and the IV ventricle (I,J). (K) PCR for Sema3A on DNA extracted from the ChP of mice injected with AAV5-CAG-GFP or AAV5-CAG-Cre. A band of 0.5 kb is apparent in the Cre condition. (LQ) Sema3A levels around neurons of the IntA (LN) and IntP (OQ) are increased in ChP KO mice. (N,Q) Cumulative frequency and violin plots of the intensity of individual Sema3A+ PNNs in the IntA and IntP of ChP GFP mice (blue) and ChP KO mice (red) (IntA, ChP GFP: n = 109, ChP KO: n = 102; IntP, ChP GFP: n = 116, ChP KO: n = 101). The median is represented by a black line. Scale bar: (A,B,L,M,O,P): 40 µm; (E,H): 600 µm; (F,G,I,J): 100 µm. * p < 0.05, ** p < 0.01.
Figure 3
Figure 3
Globally knocking out Sema3A decreases Sema3A content in PNNs. (AD) GFP (A,C) and Cre expressing cells (B,D) in the Int ((A,B); dashed line) and the S1bf ((C,D); cortical layers are indicated by roman numbers) after injection of AAV5-CAG-Cre, AAV-PHP.eB-L7-Cre, and AAV-PHP.eB-SYN-CreGFP in Sema3Afl/fl mice. (E) PCR for Sema3A on DNA extracted from the somatosensory cortex of global GFP and global KO mice. A correct excision in the Sema3A gene occurred in global KO mice. (FN) Sema3A immunoreactivity is decreased in the IntA (FH), the IntP (IK), and the S1bf (LN) of global KO mice. (H,K,N) Cumulative frequency and violin plots of the intensity of individual Sema3A+ PNNs in global (glo.) GFP mice (blue) and global KO mice (red) (IntA, global GFP: n = 162, global KO: n = 148; IntP, global GFP: n = 335, global KO: n = 187; S1bf, global GFP: n = 1660, global KO: n = 1074). The median is represented by a black line. Scale bar: (AD): 200 µm; (F,G,I,J): 40 µm; (L,M): 100 µm. ** p < 0.01, **** p < 0.0001.
Figure 4
Figure 4
Cre expression throughout the CNS leads to motor deficits. Rotarod performance of global GFP mice (blue line) and global KO mice (red line). The latency to fall (seconds) is measured on three consecutive days (D) (global GFP: N = 6, global KO: N = 4). *** p < 0.001, **** p < 0.0001.
Figure 5
Figure 5
Cre expression throughout the CNS leads to neuroinflammation. (AD,M,N) Increase in Iba1 immunoreactivity in the SC ventral horn of global KO mice and CD-1 Cre mice when compared to global GFP and CD-1 uninjected (uninj.) mice, respectively (global GFP: N = 6, global KO: N = 5; CD-1 uninjected N = 4, CD-1 Cre N = 3). (EH,M,N) Increase in Iba1 immunoreactivity in the Int of global KO mice and CD-1 Cre mice when compared to global GFP and CD-1 uninjected mice, respectively (global GFP: N = 6, global KO: N = 6; CD-1 uninjected N = 4, CD-1 Cre N = 5). (I,J,M) No change in Iba1 intensity in the SNc of global KO mice when compared to global GFP mice (global GFP: n = 6, global KO: n = 6). (K,L,N) Increase in Iba1 levels in the SNc of CD1 Cre injected mice when compared to CD-1 uninjected mice (CD-1 uninjected N = 4, CD-1 Cre N = 5). Regions of interest are outlined by dashed lines. Scale bar: (AL): 150 µm. * p < 0.05, ** p < 0.01.
Figure 6
Figure 6
Cre expression throughout the CNS leads to neurodegeneration in the Int. (AC) No change in NeuN+ neuronal density is apparent in the SC ventral horn of global KO mice when compared to global GFP mice (global GFP: N = 6, global KO: N = 5). (DF) No change in TH+ neuronal density is apparent in the SNc of global KO mice when compared to global GFP mice (global GFP: N = 6, global KO: N = 6). (GL) NeuN+ density is decreased in the Int of global KO mice when compared to global GFP mice (global GFP: N = 6, global KO: N = 6) (GI) as well as in the Int of CD-1 Cre mice when compared to CD-1 uninjected (uninj.) mice (CD-1 uninjected: N = 4, CD-1 Cre: N = 5) (JL). Regions of interest are outlined by dashed lines. Scale bar: (A,B,G,H,J,K): 150 µm; (D,E): 200 µm. ** p < 0.01, *** p < 0.001.

Similar articles

References

    1. Kolodkin A.L., Matthes D.J., Goodman C.S. The Semaphorin Genes Encode a Family of Transmembrane and Secreted Growth Cone Guidance Molecules. Cell. 1993;75:1389–1399. doi: 10.1016/0092-8674(93)90625-Z. - DOI - PubMed
    1. Luo Y., Raible D., Raper J.A. Collapsin: A Protein in Brain That Induces the Collapse and Paralysis of Neuronal Growth Cones. Cell. 1993;75:217–227. doi: 10.1016/0092-8674(93)80064-L. - DOI - PubMed
    1. Giger R.J., Pasterkamp R.J., Heijnen S., Holtmaat A.J.G.D., Verhaagen J. Anatomical Distribution of the Chemorepellent Semaphorin III/Collapsin-1 in the Adult Rat and Human Brain: Predominant Expression in Structures of the Olfactory-Hippocampal Pathway and the Motor System. J. Neurosci. Res. 1998;52:27–42. doi: 10.1002/(SICI)1097-4547(19980401)52:1<27::AID-JNR4>3.0.CO;2-M. - DOI - PubMed
    1. Vo T., Carulli D., Ehlert E.M.E., Kwok J.C.F., Dick G., Mecollari V., Moloney E.B., Neufeld G., De Winter F., Fawcett J.W., et al. The Chemorepulsive Axon Guidance Protein semaphorin3A Is a Constituent of Perineuronal Nets in the Adult Rodent Brain. Mol. Cell. Neurosci. 2013;56:186–200. doi: 10.1016/j.mcn.2013.04.009. - DOI - PubMed
    1. Dick G., Tan C.L., Alves J.N., Ehlert E.M.E., Miller G.M., Hsieh-Wilson L.C., Sugahara K., Oosterhof A., Van Kuppevelt T.H., Verhaagen J., et al. Semaphorin 3A Binds to the Perineuronal Nets via Chondroitin Sulfate Type E Motifs in Rodent Brains. J. Biol. Chem. 2013;288:27384–27395. doi: 10.1074/jbc.M111.310029. - DOI - PMC - PubMed

LinkOut - more resources