. 2025 Jan 10;30(2):261.
doi: 10.3390/molecules30020261.

Autophagy-Enhancing Properties of Hedyotis diffusa Extracts in HaCaT Keratinocytes: Potential as an Anti-Photoaging Cosmetic Ingredient

Affiliations

Autophagy-Enhancing Properties of Hedyotis diffusa Extracts in HaCaT Keratinocytes: Potential as an Anti-Photoaging Cosmetic Ingredient

Qiwen Zheng et al. Molecules. .

Abstract

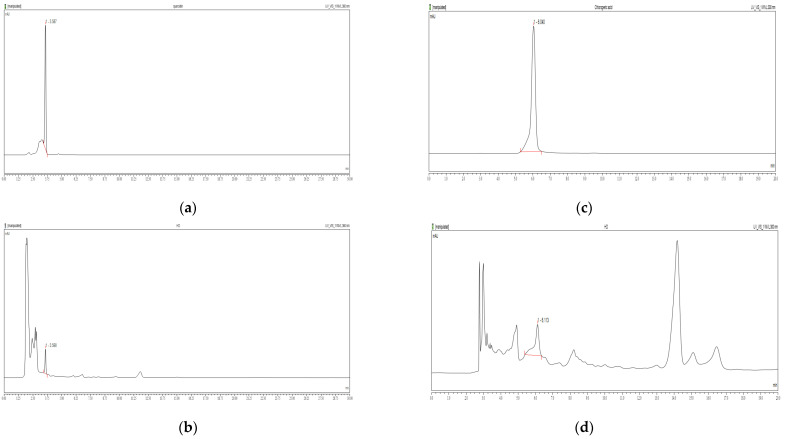
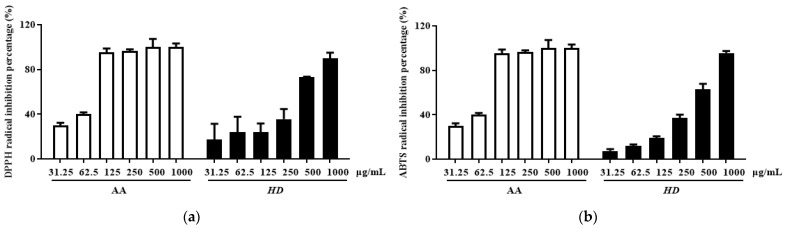
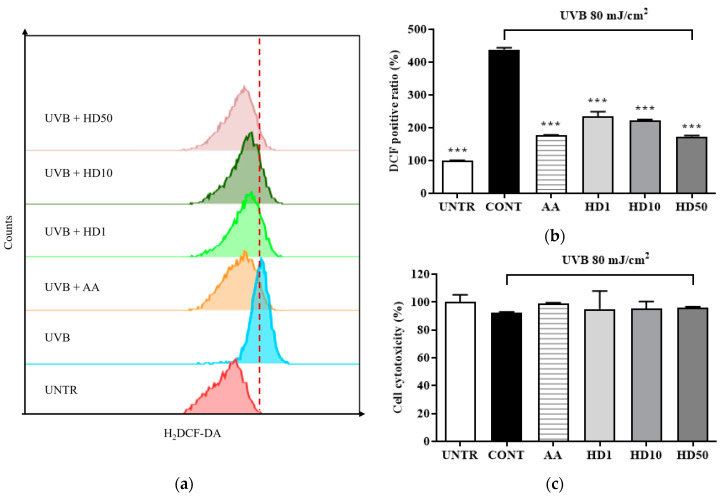
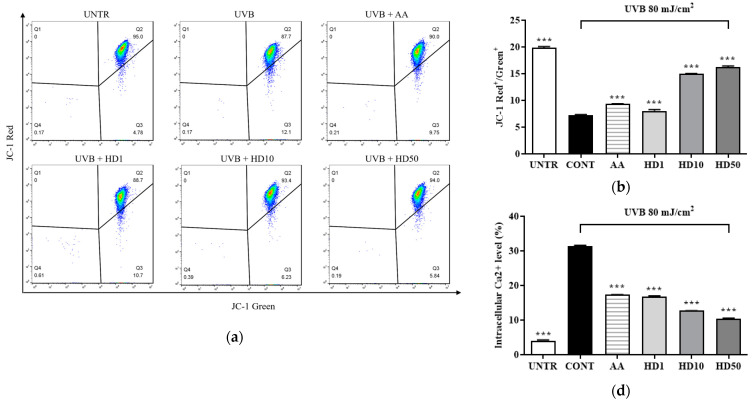
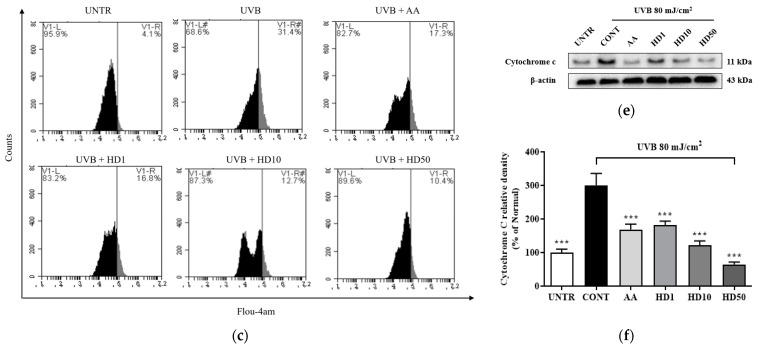
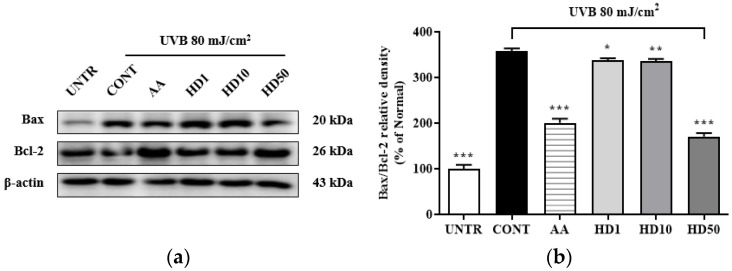
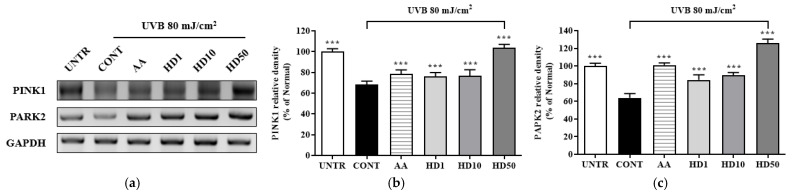
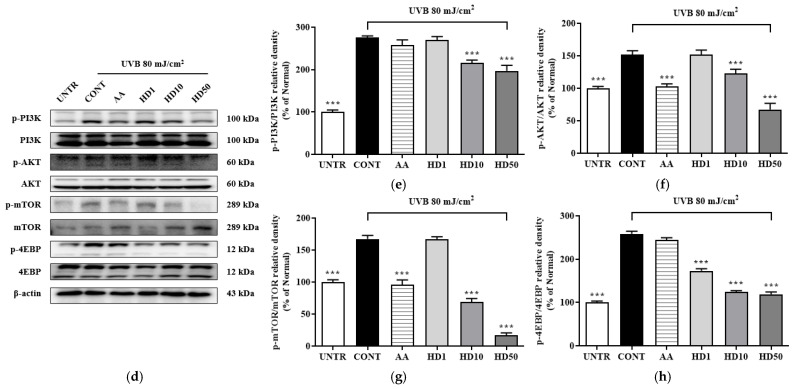
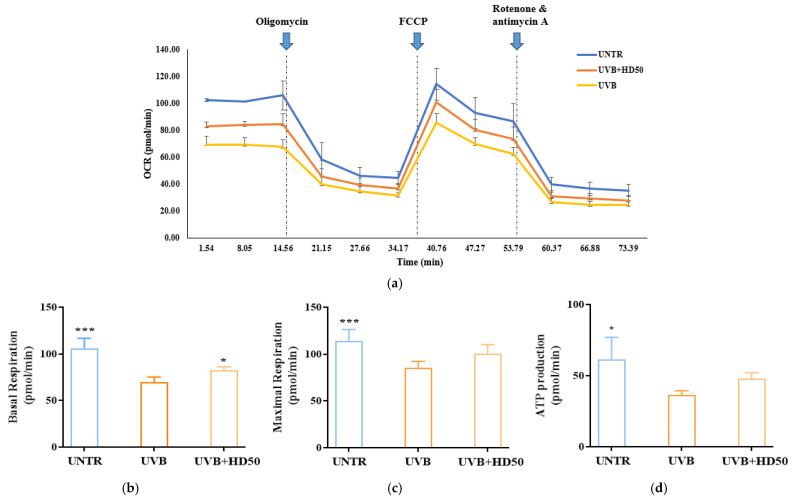
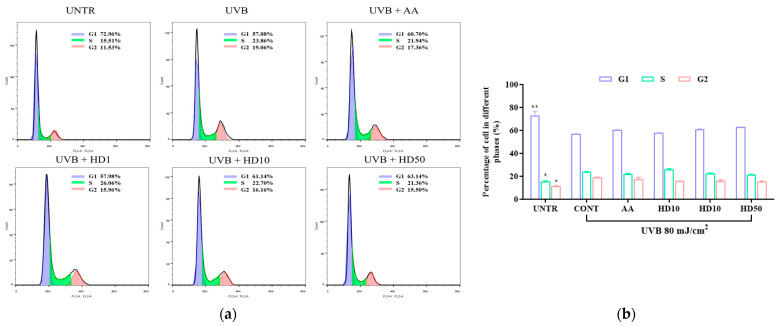
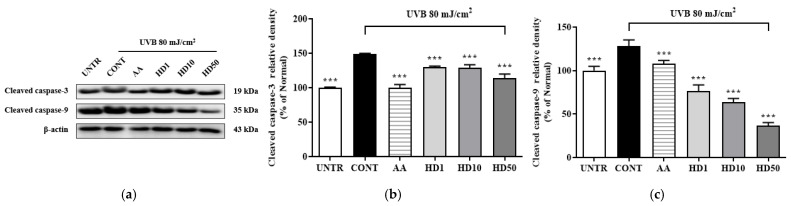
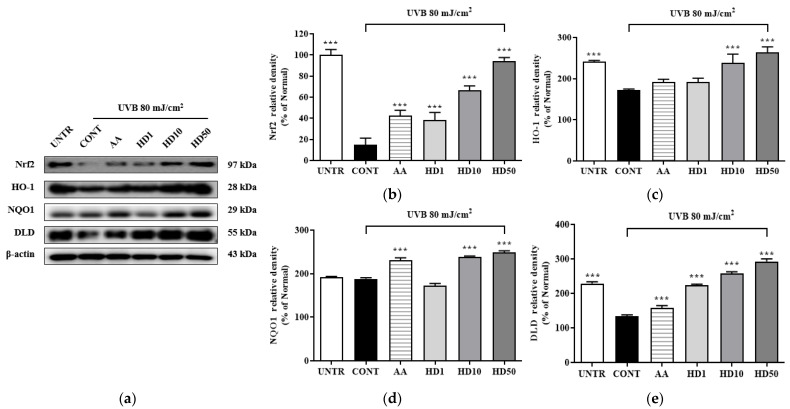
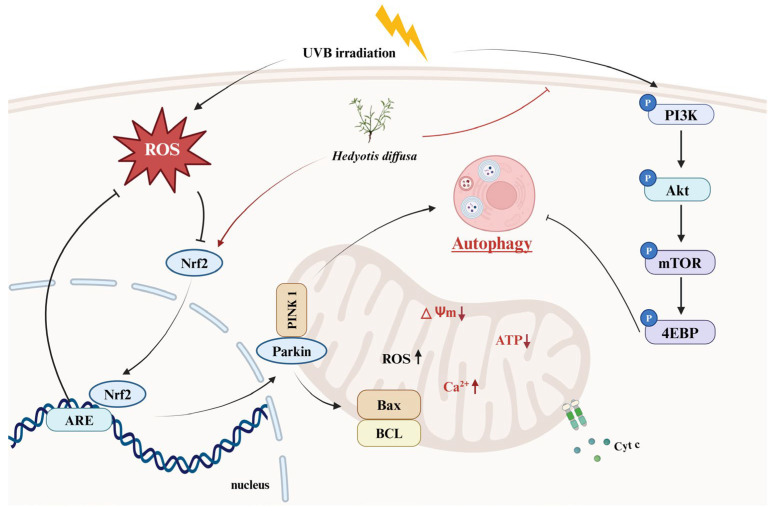
The decline in autophagy disrupts homeostasis in skin cells, leading to oxidative stress, energy deficiency, and inflammation-all key contributors to skin photoaging. Consequently, activating autophagy has become a focal strategy for delaying skin photoaging. Natural plants are rich in functional molecules and widely used in the development of anti-photoaging cosmetics. Hedyotis diffusa (HD), as a medicinal plant, is renowned for its anti-inflammatory and anticancer properties; however, its effects on skin photoaging remain unclear. This study investigates HD's potential to counteract skin photoaging by restoring mitochondrial autophagy in keratinocytes. We used HPLC to detect the main chemical components in HD and, using a UVB-induced photoaging model in HaCaT keratinocytes, examined the effects of HD on reactive oxygen species (ROS) levels, Ca2+ concentration, mitochondrial membrane potential (MMP), apoptosis, and the cell cycle. Cellular respiration was further evaluated with the Seahorse XFp Analyzer, and RT-PCR and Western blotting were used to analyze the impact of HD on mitochondrial autophagy-related gene expression and signaling pathways. Our findings indicate that HD promotes autophagy by modulating the PI3K/AKT/mTOR and PINK/PARK2 pathways, which stabilizes mitochondrial quality, maintains MMP and Ca2+ balance, and reduces cytochrome c release. These effects relieve cell cycle arrest and prevent apoptosis associated with an increased BAX/BCL-2 ratio. Thus, HD holds promise as an effective anti-photoaging ingredient with potential applications in the development of cosmetic products.

Keywords: HaCaT keratinocytes; Hedyotis diffusa; anti-photoaging; autophagy-enhancing.


Conflict of interest statement

The authors declare no conflicts of interest.

Figures

Figure 1
Figure 1
HPLC chromatograms of quercetin standards (a) and HD (b) at 360 nm, and chlorogenic acid standards (c) and HD (d) at 300 nm were obtained using a Discovery C18 column.
Figure 2
Figure 2
HD scavenging capacity for DPPH radicals (a) and ABTS radicals (b). Data are expressed as the mean ± SD from three independent replicates. AA represents ascorbic acid as a positive control group, and HD refers to Hedyotis diffusa.
Figure 3
Figure 3
Flow cytometry (FACs) results for intracellular ROS levels detected using the 2′,7′-dichloro fluorescein diacetate (DCFH-DA) dye are shown in (a), with (b) presenting the quantified data as a histogram. Cell viability following HD treatment is shown in (c). Data are expressed as the mean ± SD from three independent replicates. *** p-value < 0.001 compared to the UVB-only treatment cells. AA represents 10 μM ascorbic acid as a positive control group, and HD1, 10, and 50 refer to Hedyotis diffusa at concentrations of 1, 10, and 50 μg/mL.
Figure 4
Figure 4
FACs results of intracellular MMP levels (a), with (b) showing the quantified data as a histogram. FACs results of intracellular Ca2+ levels (c), and (d) provide the corresponding quantified data in histogram form. Western blot result of the effect of HD on extramitochondrial cytochrome C (e), quantified by histogram (f). Data are expressed as the mean ± SD from three independent replicates. *** p-value < 0.001 compared to the UVB-only treatment group. AA represents 10 μM Ascorbic acid as a positive control group, and HD1, 10, and 50 refer to Hedyotis diffusa at concentrations of 1, 10, and 50 μg/mL.
Figure 4
Figure 4
FACs results of intracellular MMP levels (a), with (b) showing the quantified data as a histogram. FACs results of intracellular Ca2+ levels (c), and (d) provide the corresponding quantified data in histogram form. Western blot result of the effect of HD on extramitochondrial cytochrome C (e), quantified by histogram (f). Data are expressed as the mean ± SD from three independent replicates. *** p-value < 0.001 compared to the UVB-only treatment group. AA represents 10 μM Ascorbic acid as a positive control group, and HD1, 10, and 50 refer to Hedyotis diffusa at concentrations of 1, 10, and 50 μg/mL.
Figure 5
Figure 5
Western blot results of the effects of HD on the Bax/Bcl-2 ratio are shown in (a), with quantified displayed in histograms for Bax/Bcl-2 (b). Data are expressed as the mean ± SD from three independent replicates. * p-value < 0.05, ** p-value < 0.01, and *** p-value < 0.001 compared to the UVB-only treatment group. AA represents 10 μM ascorbic acid as a positive control group, and HD1, 10, and 50 refer to Hedyotis diffusa at concentrations of 1, 10, and 50 μg/mL.
Figure 6
Figure 6
RT-PCR results of the effects of HD on the PINK1/PARK2 signaling pathway are shown in (a), with quantified displayed in histograms for PINK1 (b), and PARK2 (c). Western blot results of the effects of HD on the PI3K/AKT/mTOR signaling pathway are shown in (d), with quantified phosphorylation levels displayed in histograms for p-PI3K (e), p-AKT (f), p-mTOR (g), and p-4EBP (h). Data are expressed as the mean ± SD from three independent replicates. *** p-value < 0.001 compared to the UVB-only treatment group. AA represents 10 μM ascorbic acid as a positive control group, and HD1, 10, and 50 refer to Hedyotis diffusa at concentrations of 1, 10, and 50 μg/mL.
Figure 6
Figure 6
RT-PCR results of the effects of HD on the PINK1/PARK2 signaling pathway are shown in (a), with quantified displayed in histograms for PINK1 (b), and PARK2 (c). Western blot results of the effects of HD on the PI3K/AKT/mTOR signaling pathway are shown in (d), with quantified phosphorylation levels displayed in histograms for p-PI3K (e), p-AKT (f), p-mTOR (g), and p-4EBP (h). Data are expressed as the mean ± SD from three independent replicates. *** p-value < 0.001 compared to the UVB-only treatment group. AA represents 10 μM ascorbic acid as a positive control group, and HD1, 10, and 50 refer to Hedyotis diffusa at concentrations of 1, 10, and 50 μg/mL.
Figure 7
Figure 7
Seahorse XFp Analyzer measurements of mitochondrial respiration in cells treated with UVB and HD50 (a). Basal respiration (b), maximal respiration (c), and ATP production (d). Data are expressed as the mean ± SD from three independent replicates. * p-value < 0.05, and *** p-value < 0.001 compared to the UVB-only treatment group. HD50 refers to Hedyotis diffusa at concentrations of 50 μg/mL.
Figure 8
Figure 8
FACs analysis results of cell cycle (a), showing the quantified data as a histogram (b). Data are expressed as the mean ± SD from three independent replicates. * p-value < 0.05, and ** p-value < 0.01 compared to the UVB-only treatment group. AA represents 10 μM ascorbic acid as a positive control group, HD1, 10, and 50 refer to Hedyotis diffusa at concentrations of 1, 10, and 50 μg/mL.
Figure 9
Figure 9
Western blot results of the effects of HD on the apoptosis-related proteins are shown in (a), with quantified displayed in histograms for cleaved caspase-3 (b), and cleaved caspase-9 (c). Data are expressed as the mean ± SD from three independent replicates. *** p-value < 0.001 compared to the UVB-only treatment group. AA represents 10 μM ascorbic acid as a positive control group, and HD1, 10, and 50 refer to Hedyotis diffusa at concentrations of 1, 10, and 50 μg/mL.
Figure 10
Figure 10
Western blot results of the effects of HD on the Nrf2 signaling pathway are shown in (a), with quantified displayed in histograms for Nrf2 (b), HO-1 (c), NQO1 (d), and DLD (e). Data are expressed as the mean ± SD from three independent replicates. *** p-value < 0.001 compared to the UVB-only treatment group. AA represents 10 μM ascorbic acid as a positive control group, and HD1, 10, and 50 refer to Hedyotis diffusa at concentrations of 1, 10, and 50 μg/mL.
Figure 11
Figure 11
HD extract activates autophagy in HaCaT keratinocytes post-UVB treatment by regulating PI3K/AKT/mTOR and Nrf2.

Similar articles

Cited by

References

    1. Chung J.H., Hanft V.N., Kang S. Aging and Photoaging. J. Am. Acad. Dermatol. 2003;49:690–697. doi: 10.1067/S0190-9622(03)02127-3. - DOI - PubMed
    1. Slominski A.T., Zmijewski M.A., Plonka P.M., Szaflarski J.P., Paus R. How UV Light Touches the Brain and Endocrine System Through Skin, and Why. Endocrinology. 2018;159:1992–2007. doi: 10.1210/en.2017-03230. - DOI - PMC - PubMed
    1. Kim H., Zheng Q., Oh S., Zheng S., Kim M., Yi T.-H. Anti-Photoaging Effect of Jawoongo via Regulating Nrf2/ARE and TGF-β/Smad Signaling in In Vitro Photoaging Model. Appl. Sci. 2023;13:10425. doi: 10.3390/app131810425. - DOI
    1. Umar S.A., Tasduq S.A. Integrating DNA Damage Response and Autophagy Signalling Axis in Ultraviolet-B Induced Skin Photo-Damage: A Positive Association in Protecting Cells against Genotoxic Stress. RSC Adv. 2020;10:36317–36336. doi: 10.1039/D0RA05819J. - DOI - PMC - PubMed
    1. Song X., Narzt M.S., Nagelreiter I.M., Hohensinner P., Terlecki-Zaniewicz L., Tschachler E., Grillari J., Gruber F. Autophagy Deficient Keratinocytes Display Increased DNA Damage, Senescence and Aberrant Lipid Composition after Oxidative Stress in Vitro and in Vivo. Redox Biol. 2017;11:219–230. doi: 10.1016/j.redox.2016.12.015. - DOI - PMC - PubMed

MeSH terms