

Astrocytic HIV-1 Nef Expression Decreases Glutamate Transporter Expression in the Nucleus Accumbens and Increases Cocaine-Seeking Behavior in Rats
- PMID: 39861103
- PMCID: PMC11769493
- DOI: 10.3390/ph18010040
Astrocytic HIV-1 Nef Expression Decreases Glutamate Transporter Expression in the Nucleus Accumbens and Increases Cocaine-Seeking Behavior in Rats
Abstract
Background/objectives: Cocaine use disorder is an intersecting issue in populations with HIV-1, further exacerbating the clinical course of the disease and contributing to neurotoxicity and neuroinflammation. Cocaine and HIV neurotoxins play roles in neuronal damage during neuroHIV progression by disrupting glutamate homeostasis in the brain. Even with combined antiretroviral therapy (cART), HIV-1 Nef, an early viral protein expressed in approximately 1% of infected astrocytes, remains a key neurotoxin. This study investigates the relationship among Nef, glutamate homeostasis, and cocaine in the nucleus accumbens (NAc), a critical brain region associated with drug motivation and reward.
Methods: Male and female Sprague Dawley rats were used to compare the effects of astrocytic Nef and cocaine by molecular analysis of glutamate transporters, GLT-1 and the cysteine glutamate exchanger (xCT), in the NAc. Behavioral assessments for cocaine self-administration were used to evaluate cocaine-seeking behavior.
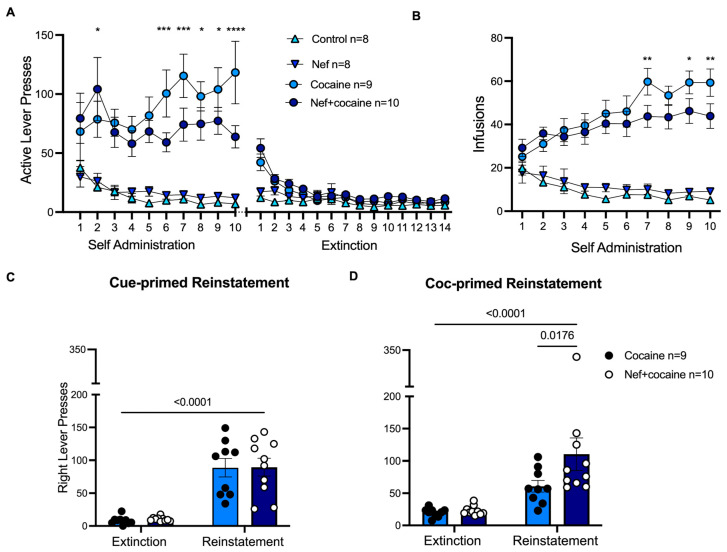
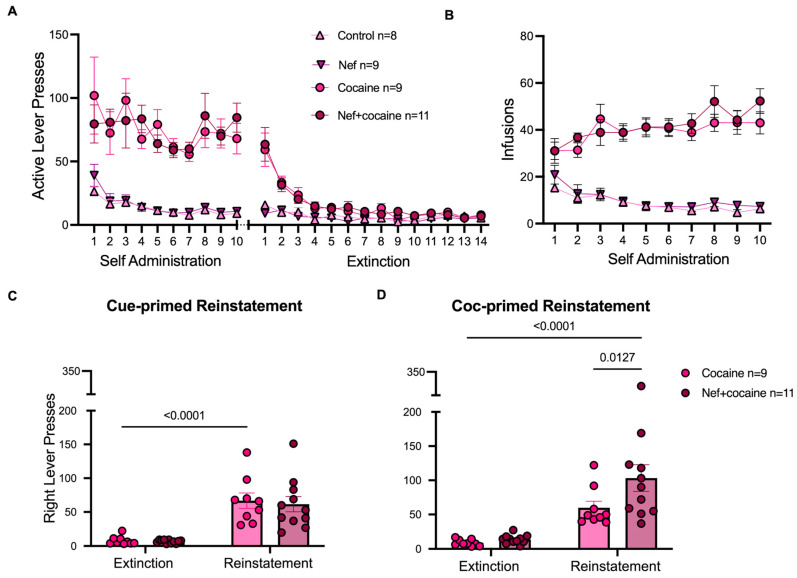
Results: The findings indicate that both cocaine and Nef independently decrease the expression of the glutamate transporter GLT-1 in the NAc. Additionally, rats with astrocytic Nef expression exhibited increased cocaine-seeking behavior but demonstrated sex-dependent molecular differences after the behavioral paradigm.
Conclusions: The results suggest that the expression of Nef intensifies cocaine-induced alterations in glutamate homeostasis in the NAc, potentially underlying increased cocaine-seeking behavior. Understanding these interactions better may inform therapeutic strategies for managing cocaine use disorder in HIV-infected individuals.
Keywords: GLT-1; HIV-1 Nef; cocaine; glutamate; nucleus accumbens; sex-differences; xCT.
Conflict of interest statement
The authors declare no conflicts of interest.
Figures


Update of
-
Astrocytic HIV-1 Nef expression decreases glutamate transporter expression in the nucleus accumbens and increases cocaine-seeking behavior in rats.bioRxiv [Preprint]. 2024 Oct 12:2024.10.10.617598. doi: 10.1101/2024.10.10.617598. bioRxiv. 2024. Update in: Pharmaceuticals (Basel). 2025 Jan 01;18(1):40. doi: 10.3390/ph18010040. PMID: 39416088 Free PMC article. Updated. Preprint.
Similar articles
-
Astrocytic HIV-1 Nef expression decreases glutamate transporter expression in the nucleus accumbens and increases cocaine-seeking behavior in rats.bioRxiv [Preprint]. 2024 Oct 12:2024.10.10.617598. doi: 10.1101/2024.10.10.617598. bioRxiv. 2024. Update in: Pharmaceuticals (Basel). 2025 Jan 01;18(1):40. doi: 10.3390/ph18010040. PMID: 39416088 Free PMC article. Updated. Preprint.
-
Contrasting the Role of xCT and GLT-1 Upregulation in the Ability of Ceftriaxone to Attenuate the Cue-Induced Reinstatement of Cocaine Seeking and Normalize AMPA Receptor Subunit Expression.J Neurosci. 2017 Jun 14;37(24):5809-5821. doi: 10.1523/JNEUROSCI.3717-16.2017. Epub 2017 May 11. J Neurosci. 2017. PMID: 28495973 Free PMC article.
-
Modulatory effects of Ampicillin/Sulbactam on glial glutamate transporters and metabotropic glutamate receptor 1 as well as reinstatement to cocaine-seeking behavior.Behav Brain Res. 2017 Aug 14;332:288-298. doi: 10.1016/j.bbr.2017.06.017. Epub 2017 Jun 15. Behav Brain Res. 2017. PMID: 28624317 Free PMC article.
-
Cocaine use disorder: A look at metabotropic glutamate receptors and glutamate transporters.Pharmacol Ther. 2021 May;221:107797. doi: 10.1016/j.pharmthera.2020.107797. Epub 2021 Jan 9. Pharmacol Ther. 2021. PMID: 33359590 Review.
-
Astrocytic dysfunction and addiction: consequences of impaired glutamate homeostasis.Neuroscientist. 2014 Dec;20(6):610-22. doi: 10.1177/1073858413520347. Epub 2014 Feb 3. Neuroscientist. 2014. PMID: 24496610 Free PMC article. Review.
References
-
- Centers for Disease Control and Prevention: HIV Surveillance Report. [(accessed on 3 May 2024)];2021 Available online: http://www.cdc.gov/hiv/library/reports/hiv-surveillance.html.
-
- Samji H., Cescon A., Hogg R.S., Modur S.P., Althoff K.N., Buchacz K., Burchell A.N., Cohen M., Gebo K.A., Gill M.J., et al. Closing the gap: Increases in life expectancy among treated HIV-positive individuals in the United States and Canada. PLoS ONE. 2013;8:e81355. doi: 10.1371/journal.pone.0081355. - DOI - PMC - PubMed
-
- Marcus J.L., Leyden W.A., Alexeeff S.E., Anderson A.N., Hechter R.C., Hu H., Lam J.O., Towner W.J., Yuan Q., Horberg M.A., et al. Comparison of Overall and Comorbidity-Free Life Expectancy Between Insured Adults With and Without HIV Infection, 2000-2016. JAMA Netw Open. 2020;3:e207954. doi: 10.1001/jamanetworkopen.2020.7954. - DOI - PMC - PubMed
-
- Maschke M., Kastrup O., Esser S., Ross B., Hengge U., Hufnagel A. Incidence and prevalence of neurological disorders associated with HIV since the introduction of highly active antiretroviral therapy (HAART) J. Neurol. Neurosurg. Psychiatry. 2000;69:376–380. doi: 10.1136/jnnp.69.3.376. - DOI - PMC - PubMed
Grants and funding
- CRG-2020-00114/PR Science Trust Catalyzer Research Grants Program
- U54 MD007579/MD/NIMHD NIH HHS/United States
- P20 GM103475/GM/NIGMS NIH HHS/United States
- 1F31DA054814-02A1/NH/NIH HHS/United States
- 1U54MD007579-39A1/NH/NIH HHS/United States
- NA - Health Research Scholarship, Jessalyn Pla Tenorio/Intellectus Foundation
- G12 MD007579/MD/NIMHD NIH HHS/United States
- 1R25GM082406-12A1/NH/NIH HHS/United States
- R25 GM082406/GM/NIGMS NIH HHS/United States
- 1P20GM103475-19A1/NH/NIH HHS/United States
- 1U54MD007579-37S1/NH/NIH HHS/United States
- 1F31DA054814-01A1/NH/NIH HHS/United States
- 1U54MD007579-38A1/NH/NIH HHS/United States
- 1U54MD007579-37A1/NH/NIH HHS/United States
LinkOut - more resources
Full Text Sources
