

Fucoidan Oligosaccharide Supplementation Relieved Kidney Injury and Modulated Intestinal Homeostasis in D-Galactose-Exposed Rats
- PMID: 39861454
- PMCID: PMC11769225
- DOI: 10.3390/nu17020325
Fucoidan Oligosaccharide Supplementation Relieved Kidney Injury and Modulated Intestinal Homeostasis in D-Galactose-Exposed Rats
Abstract
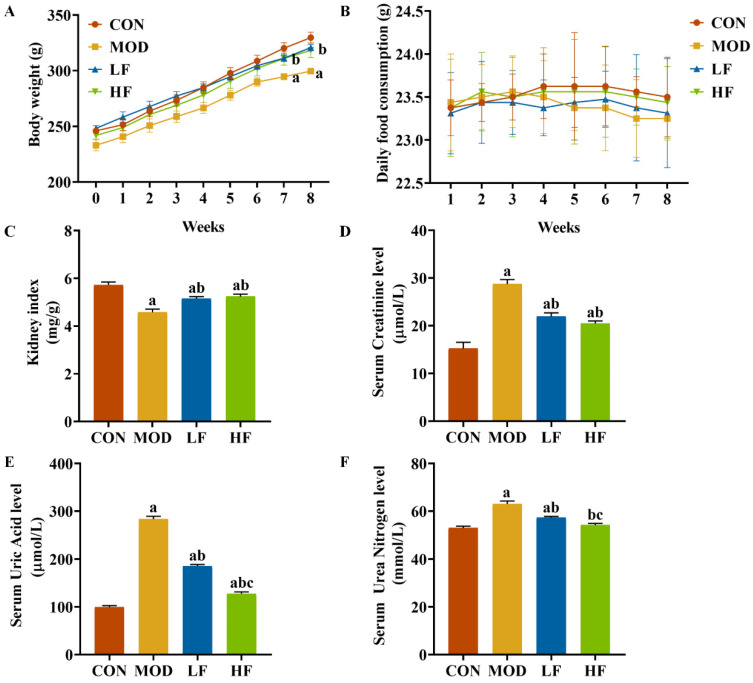
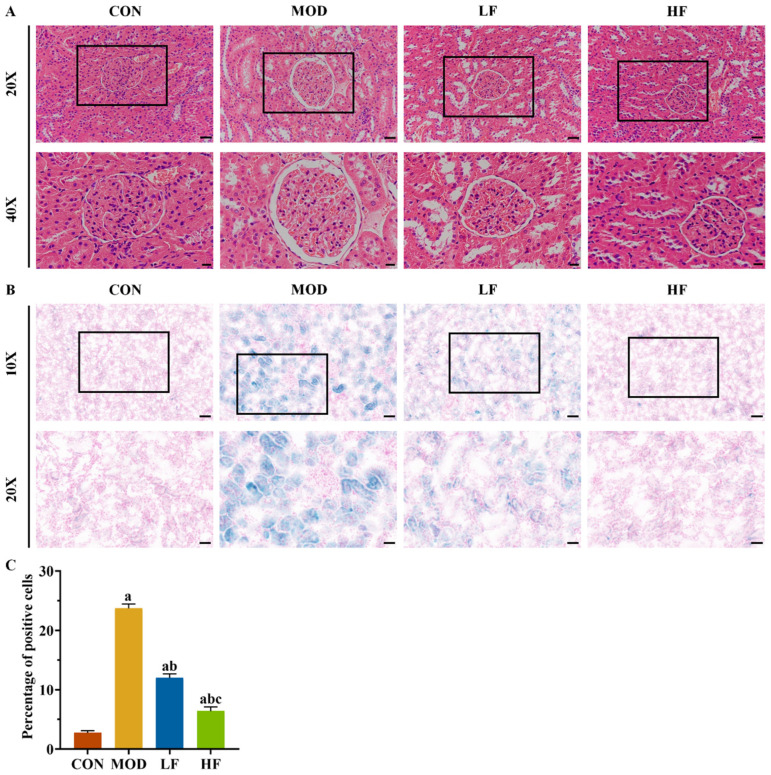
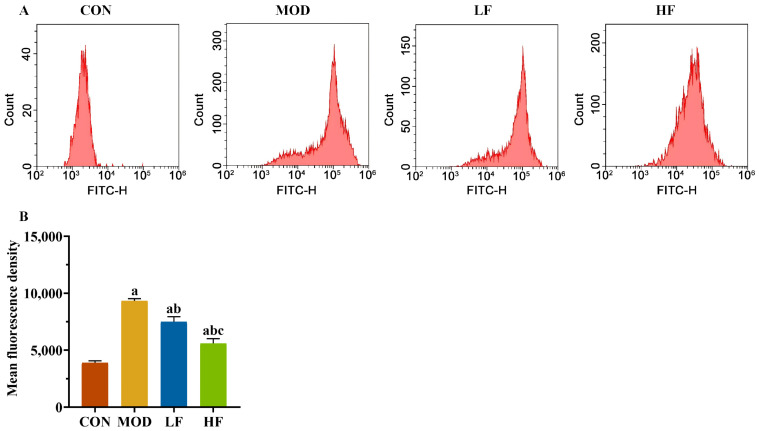
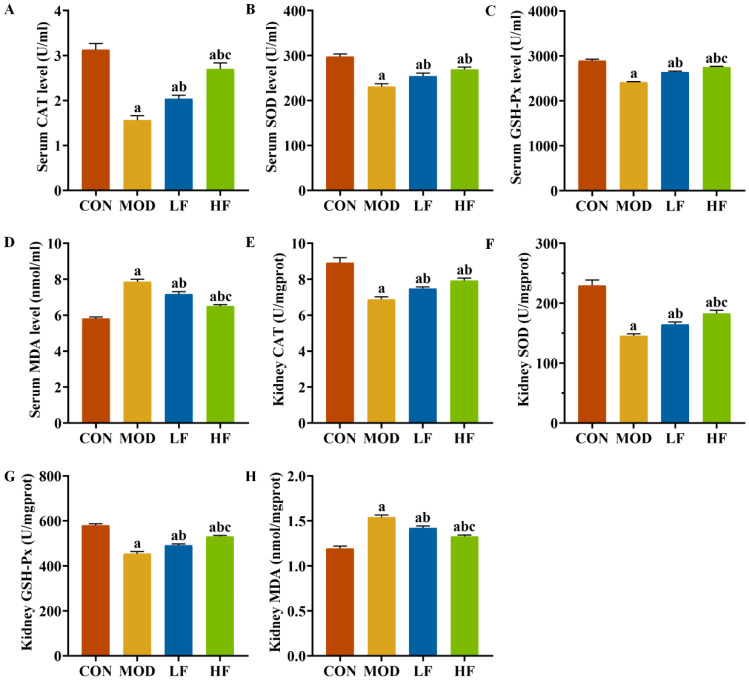
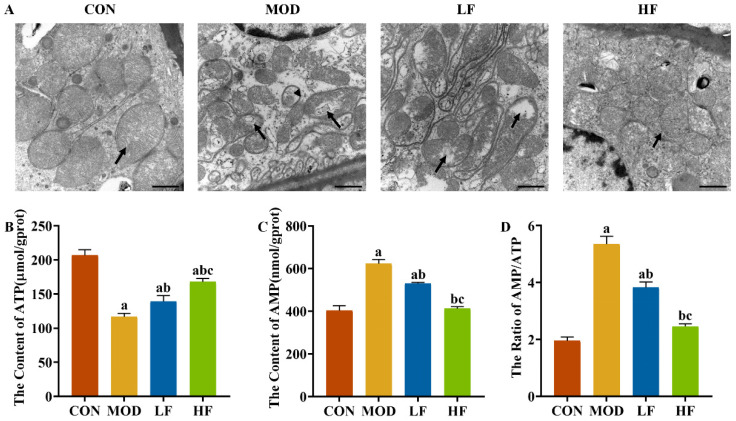
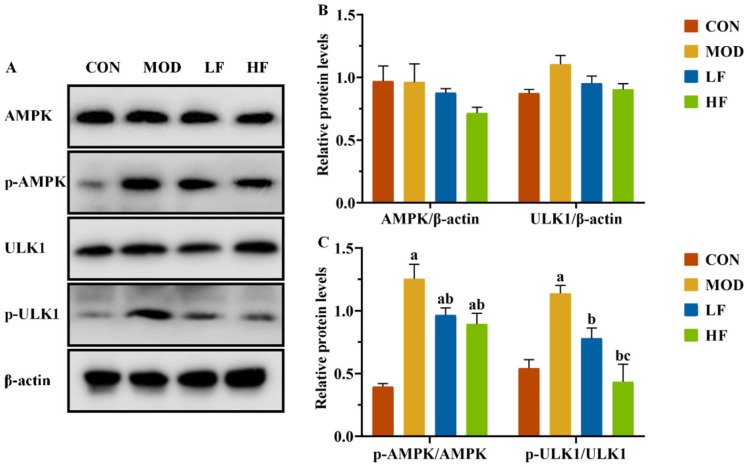
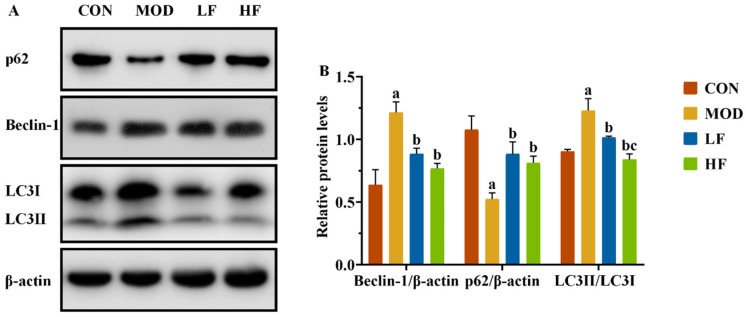
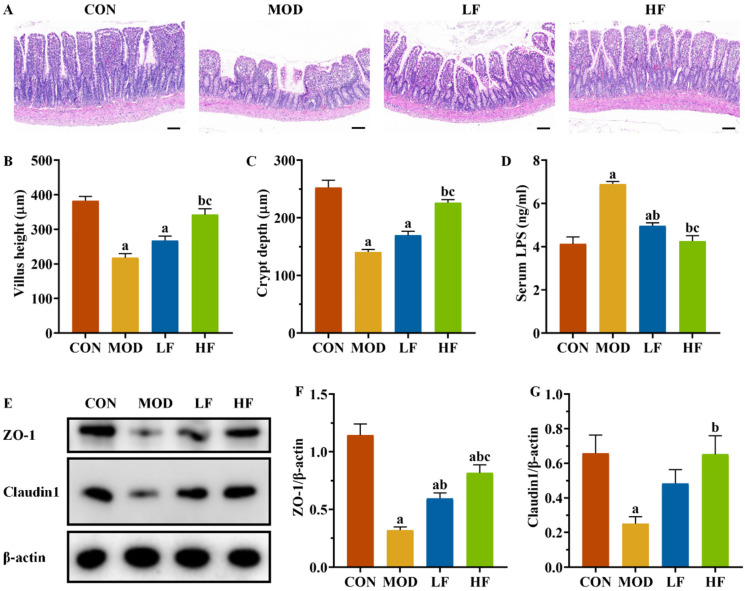
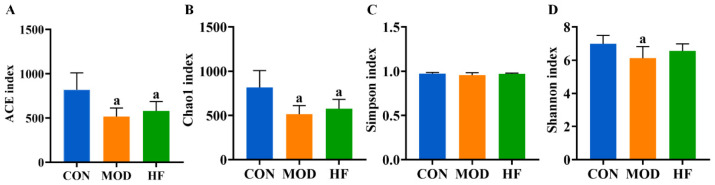
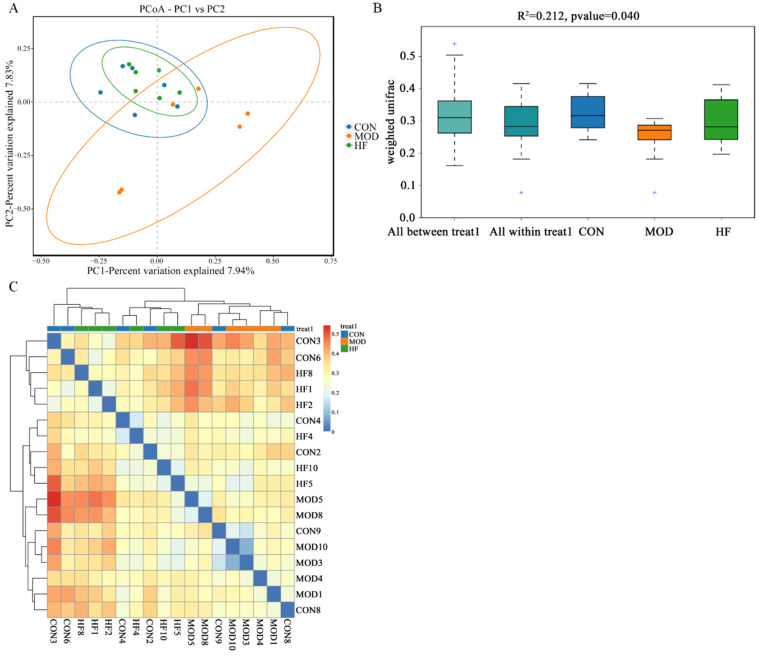
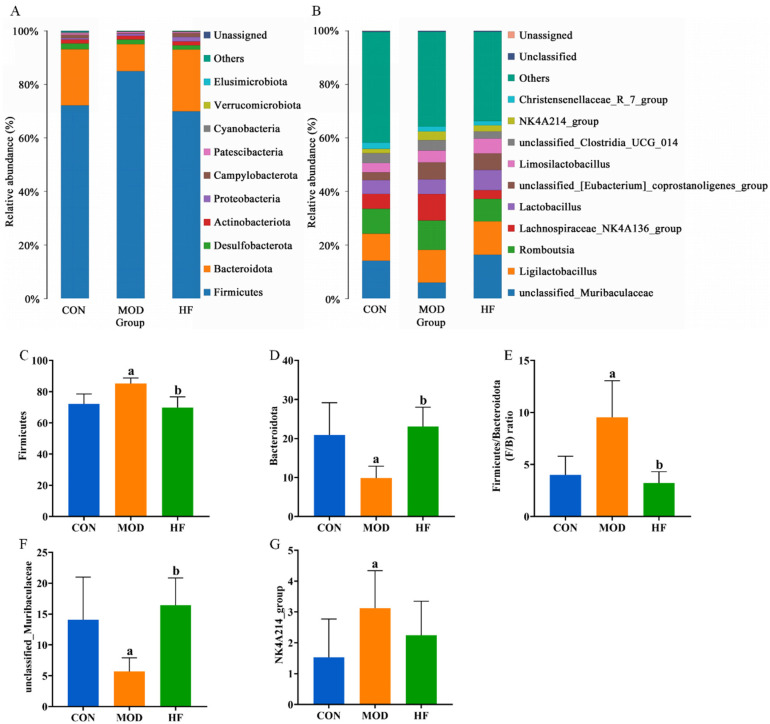
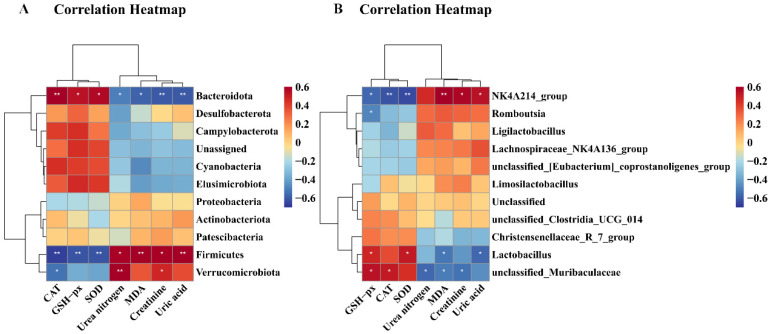
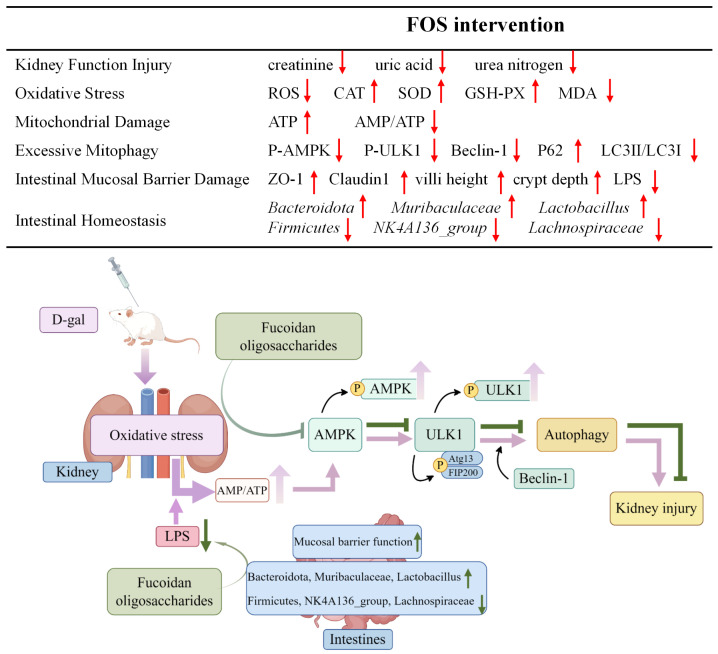
Background/Objectives: A fucoidan oligosaccharide (FOS), a potent compound derived from algae, is known for its diverse biological activities, including prebiotic activity, anticancer activity, and antioxidative properties, and has demonstrated supportive therapeutic effects in treating kidney ailments. This study was conducted to explore the protective influence of FOS on kidney damage due to aging induced by D-galactose in Sprague Dawley (SD) rats. Methods: The low-dose FOS group was administered FOS (100 mg/kg) by gavage, and the high-FOS group received FOS (200 mg/kg) by gavage. Results: The findings showed that FOS could effectively mitigate kidney damage and improve the pathological condition of kidney tissues caused by D-gal and enhance kidney function. Intervention with FOS significantly reduced serum creatinine, serum uric acid, and serum urea nitrogen levels, compared to the model group. The protective mechanism of FOS on D-gal-induced kidney injury may be to inhibit oxidative stress and improve impaired mitochondrial function by downregulating the AMPK/ULK1 signaling pathway. FOS could also modulate the expression of mitochondrial autophagy-related proteins (Beclin-1, P62, and LC3II/LC3I), thereby mitigate D-gal-induced excessive mitophagy in the kidney. Furthermore, FOS may protect against kidney injury by preserving intestinal homeostasis. FOS decreased serum lipopolysaccharide levels and enhanced intestinal mucosal barrier function. FOS upregulated the abundances of Bacteroidota, Muribaculaceae, and Lactobacillus, while it decreased the abundances of Firmicutes, NK4A136_group, and Lachnospiraceae_NK4A136_group. FOS supplementation modulated gut microbiota composition, increasing beneficial bacteria and reducing detrimental ones, potentially contributing to improved kidney function. Conclusions: FOS may safeguard against renal injury in D-gal-exposed rats by inhibiting kidney excessive mitophagy, preserving mitochondrial function, and regulating intestinal homeostasis.
Keywords: fucoidan oligosaccharide; kidney injury; mitochondrial autophagy.
Conflict of interest statement
The authors declare no conflicts of interest.
Figures
Similar articles
-
Fucoidan Supplementation Relieved Kidney Injury and Modulated Intestinal Homeostasis in Hyperuricemia Mice.J Agric Food Chem. 2024 Dec 11;72(49):27187-27202. doi: 10.1021/acs.jafc.4c07209. Epub 2024 Nov 26. J Agric Food Chem. 2024. PMID: 39600107
-
Fucoidan Improves D-Galactose-Induced Cognitive Dysfunction by Promoting Mitochondrial Biogenesis and Maintaining Gut Microbiome Homeostasis.Nutrients. 2024 May 17;16(10):1512. doi: 10.3390/nu16101512. Nutrients. 2024. PMID: 38794753 Free PMC article.
-
Protective Effects of Black Rice Anthocyanins on D-Galactose-Induced Renal Injury in Mice: The Role of Nrf2 and NF-κB Signaling and Gut Microbiota Modulation.Nutrients. 2025 Jan 29;17(3):502. doi: 10.3390/nu17030502. Nutrients. 2025. PMID: 39940360 Free PMC article.
-
Dietary glycation compounds - implications for human health.Crit Rev Toxicol. 2024 Sep;54(8):485-617. doi: 10.1080/10408444.2024.2362985. Epub 2024 Aug 16. Crit Rev Toxicol. 2024. PMID: 39150724
-
Role of Mushroom Polysaccharides in Modulation of GI Homeostasis and Protection of GI Barrier.J Agric Food Chem. 2025 Mar 19;73(11):6416-6441. doi: 10.1021/acs.jafc.5c00745. Epub 2025 Mar 10. J Agric Food Chem. 2025. PMID: 40063730 Free PMC article. Review.
Cited by
-
Therapeutic effect of fecal microbiota transplantation on hyperuricemia mice by improving gut microbiota.Front Microbiol. 2025 Aug 5;16:1599107. doi: 10.3389/fmicb.2025.1599107. eCollection 2025. Front Microbiol. 2025. PMID: 40838009 Free PMC article.
-
Protective Effects of Fucoidan on Iodoacetamide-Induced Functional Dyspepsia via Modulation of 5-HT Metabolism and Microbiota.Int J Mol Sci. 2025 Apr 1;26(7):3273. doi: 10.3390/ijms26073273. Int J Mol Sci. 2025. PMID: 40244137 Free PMC article.
References
MeSH terms
Substances
Grants and funding
LinkOut - more resources
Full Text Sources
Medical
