. 2024 Dec 28;17(1):27.
doi: 10.3390/v17010027.

Hospital-Based Surveillance of Respiratory Viruses Among Children Under Five Years of Age with ARI and SARI in Eastern UP, India

Affiliations

Hospital-Based Surveillance of Respiratory Viruses Among Children Under Five Years of Age with ARI and SARI in Eastern UP, India

Hirawati Deval et al. Viruses. .

Abstract

Acute respiratory infections (ARIs) are a leading cause of death in children under five globally. The seasonal trends and profiles of respiratory viruses vary by region and season. Due to limited information and the population's vulnerability, we conducted the hospital-based surveillance of respiratory viruses in Eastern Uttar Pradesh. Throat and nasal swabs were collected from outpatients and inpatients in the Department of Paediatrics, Baba Raghav Das (BRD) Medical College, Gorakhpur, between May 2022 and April 2023. A total of 943 samples from children aged 1 to 60 months were tested using multiplex real-time PCR for respiratory viruses in cases of ARI and SARI. Out of 943 samples tested, the highest positivity was found for parainfluenza virus [105 (11.13%) PIV-1 (79), PIV-2 (18), PIV-4 (18)], followed by adenovirus [82 (8.7%), RSV-B, [68 (7.21%)], influenza-A [46(4.9%): H1N1 = 29, H3N2 = 14), SARS CoV-2 [28 (3%)], hMPV [13(1.4%), RSV-A [4 (0.42%), and influenza-B (Victoria lineage) 1 (0.10%). The maximum positivity of respiratory viruses was seen in children between 1 to 12 months. The wide variation in prevalence of these respiratory viruses was seen in different seasons. This study enhances understanding of the seasonal and clinical trends of respiratory virus circulation and co-infections in Eastern Uttar Pradesh. The findings highlight the importance of targeted interventions to reduce the burden of respiratory infections in this region.

Keywords: ARI; human metapneumovirus (hMPV); parainfluenza virus (PIV); respiratory syncytial virus (RSV); severe acute respiratory infection; under 5 children.


Conflict of interest statement

The authors declare no conflicts of interest.

Figures
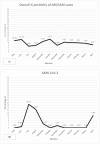
Figure 1
Figure 1
(ah). Seasonal distribution of respiratory viral pathogens. (a) Overall % Positivity of ARI/SARI Cases–The positivity rate peaks in July (11.77%). (b) SARS-CoV-2–A high positivity rate is observed in July (18.75%) and August (14.55%), followed by a drop to 0% from October to March, with a small resurgence in April (9.84%). (c) Influenza A and B–Influenza A has two distinct peaks in October (14.44%) and April (10.81%), suggesting a bimodal seasonal pattern. Influenza B, with lower positivity, peaks in January (3.38%), showing less seasonal fluctuation. (d) Human Metapneumovirus–peaks in October (7.21%). The virus has minimal activity during most months, indicating a brief seasonal presence. (e) Respiratory Syncytial Virus (RSV) A & B–. RSV B shows a significant peak in October (28.57%), while RSV A has smaller peaks in September (5.56%) and March (4.10%), suggesting different seasonal patterns for each subtype. (f) Para-Influenza Virus 1, 2, & 4–Type 1 has a high peak in May (37.04%) with rapid decline afterward. Type 3 has a small peak in October (8.33%), while types 2 and 4 remain low throughout the months, indicating type-specific seasonality. (g) Adenovirus–Displays a fluctuating positivity rate for Adenovirus with peaks in August (16.67%) and January (11.11%), showing sporadic activity and scattered occurrences without a clear seasonal trend. (h) Human Rhinovirus–Shows the positivity rate of Human Rhinovirus, which remains low overall, with a small peak in October (4.17%) and slight increases in March (3.85%) and April (1.64%), indicating minor seasonal variations.
Figure 1
Figure 1
(ah). Seasonal distribution of respiratory viral pathogens. (a) Overall % Positivity of ARI/SARI Cases–The positivity rate peaks in July (11.77%). (b) SARS-CoV-2–A high positivity rate is observed in July (18.75%) and August (14.55%), followed by a drop to 0% from October to March, with a small resurgence in April (9.84%). (c) Influenza A and B–Influenza A has two distinct peaks in October (14.44%) and April (10.81%), suggesting a bimodal seasonal pattern. Influenza B, with lower positivity, peaks in January (3.38%), showing less seasonal fluctuation. (d) Human Metapneumovirus–peaks in October (7.21%). The virus has minimal activity during most months, indicating a brief seasonal presence. (e) Respiratory Syncytial Virus (RSV) A & B–. RSV B shows a significant peak in October (28.57%), while RSV A has smaller peaks in September (5.56%) and March (4.10%), suggesting different seasonal patterns for each subtype. (f) Para-Influenza Virus 1, 2, & 4–Type 1 has a high peak in May (37.04%) with rapid decline afterward. Type 3 has a small peak in October (8.33%), while types 2 and 4 remain low throughout the months, indicating type-specific seasonality. (g) Adenovirus–Displays a fluctuating positivity rate for Adenovirus with peaks in August (16.67%) and January (11.11%), showing sporadic activity and scattered occurrences without a clear seasonal trend. (h) Human Rhinovirus–Shows the positivity rate of Human Rhinovirus, which remains low overall, with a small peak in October (4.17%) and slight increases in March (3.85%) and April (1.64%), indicating minor seasonal variations.
Figure 2
Figure 2
Seasonal distribution of ARI and SARI cases during May 2022–Apr 2023.
Figure 3
Figure 3
Co-infection of different respiratory viruses.

References

    1. Akinyemi J.O., Morakinyo O.M. Household environment and symptoms of childhood acute respiratory tract infections in Nigeria, 2003-2013: A decade of progress and stagnation. BMC Infect. Dis. 2018;18:296. doi: 10.1186/s12879-018-3207-5. - DOI - PMC - PubMed
    1. Mulambya N.L., Nanzaluka F.H., Sinyangwe N.N., Makasa M. Trends and factors associated with acute respiratory infection among under five children in Zambia: Evidence from Zambia’s demographic and health surveys (1996–2014) Pan Afr. Med. J. 2020;36:197. doi: 10.11604/pamj.2020.36.197.18799. - DOI - PMC - PubMed
    1. Berkley J.A., Munywoki P., Ngama M., Kazungu S., Abwao J., Bett A., Lassauniére R., Kresfelder T., Cane P.A., Venter M., et al. Viral etiology of severe pneumonia among Kenyan infants and children. JAMA. 2010;303:2051–2057. doi: 10.1001/jama.2010.675. - DOI - PMC - PubMed
    1. Hayden F.G. Rhinovirus and the lower respiratory tract. Rev. Med. Virol. 2004;14:17–31. doi: 10.1002/rmv.406. - DOI - PMC - PubMed
    1. Williams J.V., Edwards K.M., Weinberg G.A., Griffin M.R., Hall C.B., Zhu Y., Szilagyi P.G., Wang C.K., Yang C.F., Silva D., et al. Population-based incidence of human metapneumovirus infection among hospitalized children. J. Infect. Dis. 2010;201:1890–1898. doi: 10.1086/652782. - DOI - PMC - PubMed

Publication types

LinkOut - more resources