Task activation results in regional 13C-lactate signal increase in the human brain
- PMID: 39862181
- PMCID: PMC11765303
- DOI: 10.1177/0271678X251314683
Task activation results in regional 13C-lactate signal increase in the human brain
Abstract
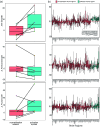
Hyperpolarized-13C magnetic resonance imaging (HP-13C MRI) was used to image changes in 13C-lactate signal during a visual stimulus condition in comparison to an eyes-closed control condition. Whole-brain 13C-pyruvate, 13C-lactate and 13C-bicarbonate production was imaged in healthy volunteers (N = 6, ages 24-33) for the two conditions using two separate hyperpolarized 13C-pyruvate injections. BOLD-fMRI scans were used to delineate regions of functional activation. 13C-metabolite signal was normalized by 13C-metabolite signal from the brainstem and the percentage change in 13C-metabolite signal conditions was calculated. A one-way Wilcoxon signed-rank test showed a significant increase in 13C-lactate in regions of activation when compared to the remainder of the brain (). No significant increase was observed in 13C-pyruvate signal () or 13C-bicarbonate signal (). The results show an increase in 13C-lactate production in activated regions that is measurable with HP-13C MRI.
Keywords: Energy metabolism; MR metabolite; MRI; lactate; molecular imaging.
Conflict of interest statement
Declaration of conflicting interestsThe author(s) declared the following potential conflicts of interest with respect to the research, authorship, and/or publication of this article: A.P.C. is employed by GE Healthcare, the manufacturer of the SPINLab polarizer. K.R.K. is co-founder of Atish Technologies and serves on the Scientific Advisory Boards of NVision Imaging Technologies and Imaginostics. He holds patents related to imaging and leveraging cellular metabolism.
Figures


Update of
-
Task Activation Results in Regional 13 C-Lactate Signal Increase in the Human Brain.bioRxiv [Preprint]. 2024 Feb 1:2024.02.01.577808. doi: 10.1101/2024.02.01.577808. bioRxiv. 2024. Update in: J Cereb Blood Flow Metab. 2025 Jul;45(7):1223-1231. doi: 10.1177/0271678X251314683. PMID: 38352450 Free PMC article. Updated. Preprint.
References
-
- Lee CY, Soliman H, Geraghty BJ, et al. Lactate topography of the human brain using hyperpolarized 13C-MRI. Neuroimage 2020; 204: 116202. - PubMed
MeSH terms
Substances
Grants and funding
LinkOut - more resources
Full Text Sources
Research Materials
Miscellaneous

