. 2025 Feb 25;44(2):115231.
doi: 10.1016/j.celrep.2025.115231. Epub 2025 Jan 23.

The Hao-Fountain syndrome protein USP7 regulates neuronal connectivity in the brain via a novel p53-independent ubiquitin signaling pathway

Affiliations

The Hao-Fountain syndrome protein USP7 regulates neuronal connectivity in the brain via a novel p53-independent ubiquitin signaling pathway

Hao Chen et al. Cell Rep. .

Abstract

Mutation or deletion of the deubiquitinase USP7 causes Hao-Fountain syndrome (HAFOUS), which is characterized by speech delay, intellectual disability, and aggressive behavior and highlights important unknown roles of USP7 in the nervous system. Here, we conditionally delete USP7 in glutamatergic neurons in the mouse forebrain, triggering disease-relevant phenotypes, including sensorimotor deficits, impaired cognition, and aggressive behavior. Although USP7 deletion induces p53-dependent neuronal apoptosis, most behavioral abnormalities in USP7 conditional knockout mice persist following p53 loss. Strikingly, USP7 deletion perturbs the synaptic proteome and dendritic spinogenesis independent of p53. Integrated proteomics and biochemical analyses identify the RNA splicing factor Ppil4 as a key substrate of USP7. Ppil4 knockdown phenocopies the effect of USP7 loss on dendritic spines. Accordingly, USP7 loss disrupts splicing of synaptic genes. These findings reveal that USP7-Ppil4 signaling regulates neuronal connectivity in the developing brain with implications for our understanding of HAFOUS pathogenesis and other neurodevelopmental disorders.

Keywords: CP: Molecular biology; CP: Neuroscience; HAFOUS; Hao-Fountain syndrome; Ppil4; RNA splicing; TMT proteomics; USP7; brain development; deubiquitinase; p53; synapse; ubiquitin.


Conflict of interest statement

Declaration of interests A.H.K. is a consultant for Monteris Medical and has received a research grant from Stryker to study a dural substitute, both of which have no direct relation to this study. A.B. is a full-time employee and shareholder of F. Hoffmann-La Roche Ltd.

Figures
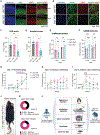
Figure 1.
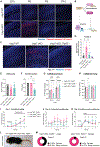
Figure 1.. USP7 deletion in glutamatergic neurons causes disease-relevant behavioral deficits in mice
(A and B) Immunofluorescence of USP7 in the cerebral cortex on embryonic day 14 (E14; A) and post-natal day 42 (P42; B). Dashed lines demarcate the cortical plate (c.p.). Scale bars, 100 μm. (C) Virtual optomotor system (VOS) test: spatial frequency threshold. **p < 0.01 by Bonferroni’s multiple-comparisons test. (D) Motor strength test: time to grip onto the inverted screen. *p < 0.05 by Dunn’s multiple-comparisons test. (E and F) CatWalk: relative mean intensity distributed onto front- and hindpaws (E) and limb swing speed (F). **p < 0.01, ***p < 0.001 by Tukey’s multiple-comparisons test. See also Video S2. (G–I) Fear conditioning: percentage of freezing time in tone/shock pairing (G), contextual conditioning (H), and auditory cued conditioning (I). *p < 0.05, **p < 0.01 by Bonferroni’s multiple-comparisons test (Usp7 WT vs. cKO). (J) Representative biting injury on mice co-caged with Usp7 cKO mice. See also Video S3. (K) Percentage of tail biters among Usp7 cKO mice from 3 to 12 weeks old. (L) Schematic of behavioral phenotypes in Usp7 cKO mice that are relevant to HAFOUS. Data are presented as mean ± SEM. See also Figure S1.
Figure 2.
Figure 2.. p53 co-deletion rescues apoptosis, impaired visual acuity, and auditory cued conditioning in Usp7 cKO mice but no other behavioral deficits
(A) Immunofluorescence of c-cas-3 in the cerebral cortex at different ages. Scale bar, 200 μm. (B) Schematic of the USP7-Mdm2-p53 signaling pathway regulating apoptosis. (C) Immunofluorescence of c-cas-3 in the cerebral cortex of mice of different Trp53 and Usp7 genotypes at P0. Scale bar, 200 μm. (D) Quantification of c-cas-3 fluorescent signal as in (C). *p < 0.05 by Tukey’s multiple-comparisons test. (E) VOS test: spatial frequency threshold. No significant genotype effect by one-way ANOVA. (F) Motor strength test: time to grip onto the inverted screen. *p < 0.05, **p < 0.01 by Dunn’s multiple-comparisons test. (G and H) CatWalk: relative mean intensity distributed onto front- and hindpaws (G) and limb swing speed (H). *p < 0.05, ***p < 0.001, ****p < 0.0001 by Tukey’s multiple-comparison test. See also Video S4. (I–K) Fear conditioning: percentage of freezing time in tone/shock pairing (I), contextual conditioning (J), and auditory cued conditioning (K). *p < 0.05 by Bonferroni’s multiple-comparisons test (Usp7 WT vs. cKO). (L) Representative biting injury on mice co-caged with Usp7 cKO; Trp53+/− mice. (M) Percentage of tail biters among Usp7 cKO; Trp53+/− mice from 3 to 12 weeks old. Data are presented as mean ± SEM. See also Figures S2 and S3.
Figure 3.
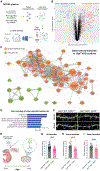
Figure 3.. USP7 loss reduces synapses in the cerebral cortex
(A) Flowchart to characterize the proteome of the cerebral cortex with 10-plex TMT-MS. (B) Volcano plot showing differentially expressed proteins in TMT-MS. The p values were calculated by 2-tailed unpaired t test with Benjamini–Hochberg correction. (C) Network of GO gene sets de-enriched in Usp7 cKO cortices based on TMT protein abundance. Nodes represent gene sets (q < 0.01), and size of nodes represents number of genes. Edges represent GO-defined relations (similarity > 0.5), and thickness of edges represents similarity between gene sets. Interconnected synapse-related gene sets are circled and colored in orange. (D) GO terms enriched from downregulated proteins (Usp7 cKO/WT fold change < 0.75). (E) Schematic of in vivo dendritic spine analysis of cortical pyramidal neurons. (F) Representative GFP micrographs of dendritic spines (arrowheads) on apical and basal dendrites. Scale bar, 5 μm. (G–I) Spine density on apical, basal, and all dendrites of pyramidal neurons in the motor cortex. ****p < 0.0001 by 2-tailed unpaired t test. Data are presented as mean ± SEM. See also Figure S4.
Figure 4.
Figure 4.. Interactome of the USP7 TRAF domain in cortical neurons
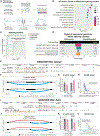
(A) Domain structure of mouse USP7 protein. R105, D165, and W165 are three amino acids necessary for substrate binding., USP, ubiquitin-specific protease domain; Ubl, ubiquitin-like domain. (B) Silver staining of the FLAG-immunoprecipitated USP7 TRAF domain (arrowhead) with and without RDW mutations (R105A+D165A+W166A). (C) Protein-protein association map of the top 50 USP7 TRAF interactors (full STRING network, confidence > 0.4). Proteins in complexes are colored according to (D). (D) GO analysis (cellular component) of the top 50 USP7 TRAF interactors. nBAF complex, neuronal SWI/SNF (BAF) complex. (E) Heatmap showing adjusted p values for enrichment of the USP7 TRAF interactors in disease genes. ID, intellectual disability; ADHD, attention deficit hyperactivity disorder; SCZ, schizophrenia; Ns, not significant. The p values were calculated by one-sided hypergeometric test with Benjamini-Hochberg correction. See also Figure S5.
Figure 5.
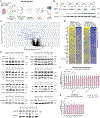
Figure 5.. Acute USP7 loss transforms the proteome of cortical neurons and depletes candidate substrate at the protein level
(A) Flowchart to characterize dynamics of the neuronal proteome in response to acute Usp7 knockout with 16-plex TMT-MS. (B) Immunoblot of USP7 depletion and Cre expression in primary cortical neurons over time. 14–3-3 is the loading control. (C) Volcano plot showing candidate substrates of USP7. Euclidean distances to USP7 were calculated in the space of TMT protein abundance. The p values were calculated by two-way ANOVA for Cre effect with Benjamini–Hochberg correction. (D) Heatmap of TMT protein abundance of USP7 and its candidate substrates. (E and F) Immunoblot images (E) and densitometric quantification (F) of candidate substrates in the cerebral cortex of Usp7 cKO; Trp53+/− (n = 3) mice vs. Usp7 WT; Trp53+/− (n = 3) mice at P0. 14–3-3 and lamin A/C are loading controls. Arrowheads indicate multiple specific bands of a single candidate substrate. *p < 0.05, ***p < 0.001, ****p < 0.0001 by Šídák multiple-comparisons test. (G) RT-qPCR of candidate substrates in the cerebral cortex of Usp7 cKO; Trp53+/− (n = 5) mice vs. Usp7 WT; Trp53+/− (n = 3) mice at P0. ****p < 0.0001 by Šídák multiple-comparisons test. Data are presented as mean ± SEM. See also Figure S6.
Figure 6.
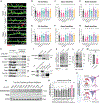
Figure 6.. USP7 targets and deubiquitinates Ppil4 to promote dendritic spinogenesis
(A) Representative GFP and PSD95 micrographs of dendritic spines (arrowheads) of DIV18 primary cortical neurons with knockdown of Ppil4 or luciferase (Luci). Micrographs of dendritic spines with knockdown of other candidate substrates are shown in Figure S8. Scale bar, 5 μm. (B–G) Density of all (B–D) and PSD95+ (E–G) spines on apical, basal, and all dendrites of cortical neurons. *p < 0.05, **p < 0.01, ***p < 0.001, ****p < 0.0001 by Dunnett’s multiple-comparisons test (compared to Luci). (H) Streptavidin pull-down of HEK293T lysate with overexpression of streptavidin-binding peptide-FLAG (SFB)-tagged USP7 followed by immunoblot analyses. (I) IP of endogenous Ppil4 in HEK293T lysates followed by immunoblot analyses. (J) Reciprocal IP of endogenous USP7 and Ppil4 in mouse brain at age P4, followed by immunoblot analyses. Input lysate with long exposure for clear visualization is shown on the left. (K) TUBE pull-down of MG132-treated neuronal lysate with USP7 loss driven by lentiviral Cre followed by immunoblotting of Ppil4. Densitometric quantification is shown at the bottom. IB, immunoblot; a.u., arbitrary unit. (L and M) In vitro deubiquitination using FLAG-immunoprecipitated Ppil4 from MG132-treated HEK293T cells (L) and densitometric quantification (M) of high-molecular-weight Ppil4 over all Ppil4 signals with 3 biological replicates. **p < 0.01 by 2-tailed unpaired t test. (N and O) Immunoblot and densitometric quantification (n = 5 biological replicates) of endogenous Ppil4 in HEK293T cells expressing patient variants of USP7. USP7 C223A is catalytically dead as a positive control. *p < 0.05, **p < 0.01 by Dunnett’s multiple-comparisons test after repeated-measurement one-way ANOVA. (P) Schematic of the USP7-Ppil4 signaling pathway regulating dendritic spines. Data are presented as mean ± SEM. See also Figure S7.
Figure 7.
Figure 7.. USP7 loss disrupts RNA splicing of synaptic genes in the cerebral cortex
(A) Flowchart to analyze RNA splicing upon USP7 loss. (B) GO terms enriched from genes of differential splicing clusters in LeafCutter analysis (FDR < 0.05 between Usp7 WT; Trp53+/− and Usp7 cKO; Trp53+/− mice). (C) Cumulative frequency curves of LeafCutter FDR of fully annotated and cryptic splicing clusters. Cumulative frequency curves for differential splicing clusters are expanded in the inset. *p < 0.05 by Kolmogorov-Smirnov test. (D) Percentage breakdown of exon-exon junction subtypes in differential and nondifferential splicing clusters. (E) Gene structure of Stxbp1. (F–H) Inclusion of exon 19 of Stxbp1, shown by LeafCutter sashimi plot (F), isoform-specific RT-qPCR bar plot (G), and volcano plot of all peptides mapped to Stxbp1 in TMT-MS (H). *p < 0.05 by uncorrected Fisher’s least significant difference (LSD) multiple-comparisons test. (I) Gene structure of Kalrn. (J–L) Usage of exon 34a or exon34b of Kalrn, shown by LeafCutter sashimi plot (J), isoform-specific RT-qPCR bar plot (K), and volcano plot of all peptides mapped to Stxbp1 in TMT-MS (L). ****p < 0.0001 by uncorrected Fisher’s LSD multiple-comparisons test. Data are presented as mean ± SEM. See also Figures S8 and S9.

Update of

References

    1. Kishino T, Lalande M, and Wagstaff J (1997). UBE3A/E6-AP mutations cause Angelman syndrome. Nat. Genet. 15, 70–73. 10.1038/ng0197-70. - DOI - PubMed
    1. Margolin DH, Kousi M, Chan Y-M, Lim ET, Schmahmann JD, Hadjivassiliou M, Hall JE, Adam I, Dwyer A, Plummer L, et al. (2013). Ataxia, dementia, and hypogonadotropism caused by disordered ubiquitination. N. Engl. J. Med. 368, 1992–2003. 10.1056/NEJMoa1215993. - DOI - PMC - PubMed
    1. Alqwaifly M, and Bohlega S (2016). Ataxia and Hypogonadotropic Hypogonadism with Intrafamilial Variability Caused by RNF216 Mutation. Neurol. Int 8, 6444. 10.4081/ni.2016.6444. - DOI - PMC - PubMed
    1. Ferguson CJ, Urso O, Bodrug T, Gassaway BM, Watson ER, Prabu JR, Lara-Gonzalez P, Martinez-Chacin RC, Wu DY, Brigatti KW, et al. (2022). APC7 mediates ubiquitin signaling in constitutive heterochromatin in the developing mammalian brain. Mol. Cell 82, 90–105.e13. 10.1016/j.molcel.2021.11.031. - DOI - PMC - PubMed
    1. Yamada T, Yang Y, and Bonni A (2013). Spatial organization of ubiquitin ligase pathways orchestrates neuronal connectivity. Trends Neurosci. 36, 218–226. 10.1016/j.tins.2012.12.004. - DOI - PMC - PubMed

Publication types

Associated data

LinkOut - more resources