. 2025 Jan 26;16(1):1041.
doi: 10.1038/s41467-025-56318-7.

Longitudinal omics data and preclinical treatment suggest the proteasome inhibitor carfilzomib as therapy for ibrutinib-resistant CLL

Affiliations

Longitudinal omics data and preclinical treatment suggest the proteasome inhibitor carfilzomib as therapy for ibrutinib-resistant CLL

Lavinia Arseni et al. Nat Commun. .

Abstract

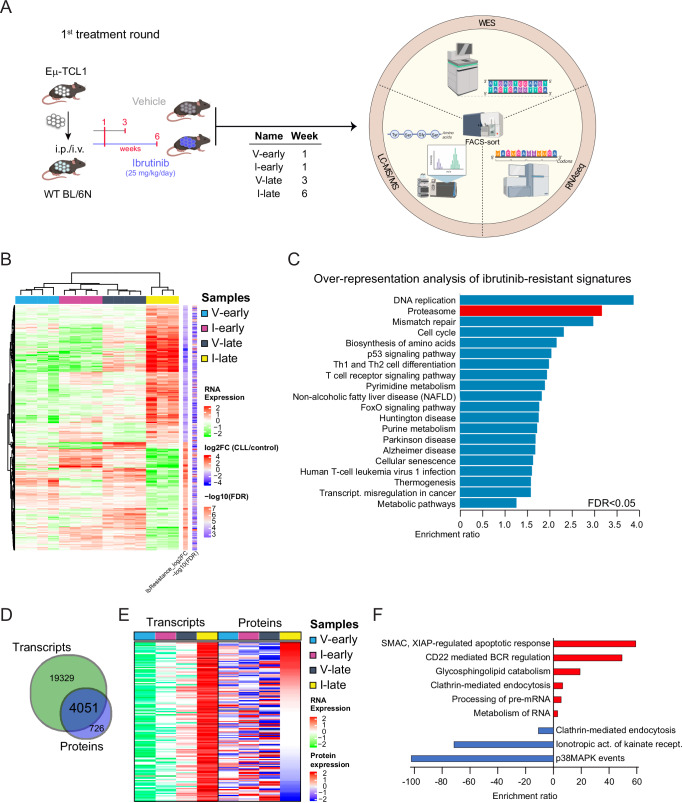
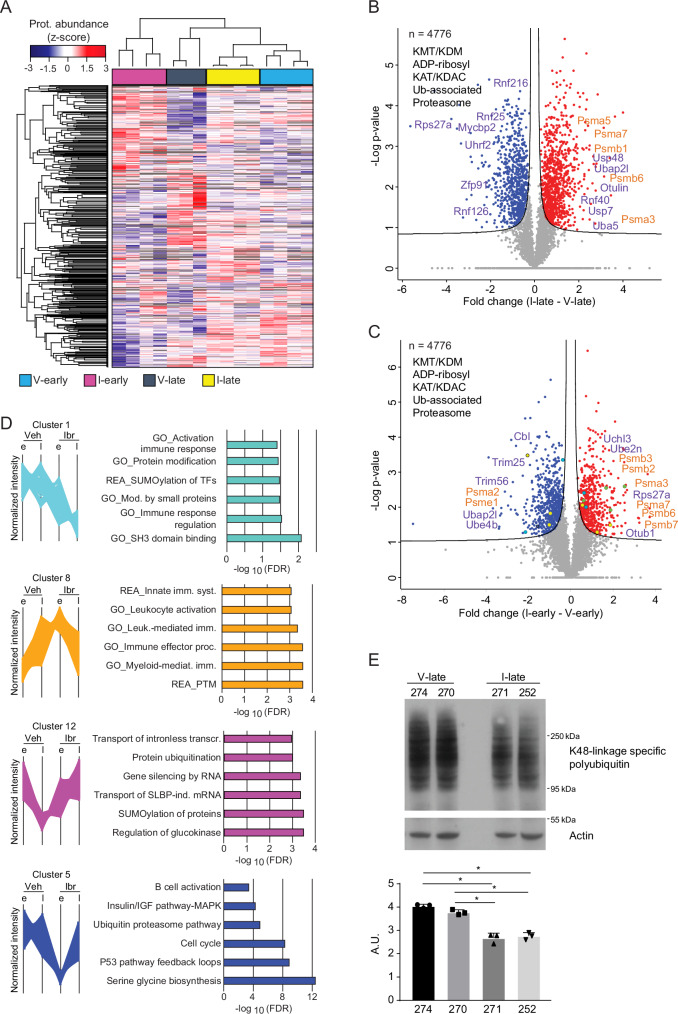
Chronic lymphocytic leukemia is a malignant lymphoproliferative disorder for which primary or acquired drug resistance represents a major challenge. To investigate the underlying molecular mechanisms, we generate a mouse model of ibrutinib resistance, in which, after initial treatment response, relapse under therapy occurrs with an aggressive outgrowth of malignant cells, resembling observations in patients. A comparative analysis of exome, transcriptome and proteome of sorted leukemic murine cells during treatment and after relapse suggests alterations in the proteasome activity as a driver of ibrutinib resistance. Preclinical treatment with the irreversible proteasome inhibitor carfilzomib administered upon ibrutinib resistance prolongs survival of mice. Longitudinal proteomic analysis of ibrutinib-resistant patients identifies deregulation in protein post-translational modifications. Additionally, cells from ibrutinib-resistant patients effectively respond to several proteasome inhibitors in co-culture assays. Altogether, our results from orthogonal omics approaches identify proteasome inhibition as potentially attractive treatment for chronic lymphocytic leukemia patients resistant or refractory to ibrutinib.


Conflict of interest statement

Competing interests: S.S.S. has received honoraria from AbbVie, AstraZeneca, BeiGene, and Janssen, and research support from BeiGene and TG Therapeutics outside of this work. E.T. has received honoraria from Abbvie, Janssen, AstraZeneca, BeiGene and research support by Abbvie, Hofmann-La Roche and Janssen-Cilag. StSt has received advisory board honoraria, research support, travel support, speaker fees from AbbVie, AstraZeneca, BeiGene, BMS, Gilead, GSK, Hoffmann-La Roche, Janssen, Novartis, and Sunesis. JD has received research funding from Roche/Genentech. MS has received advisory board honoraria from AbbVie and research support from Bayer AG. The remaining authors declare no competing interests.

Figures

Fig. 1
Fig. 1. Prolonged ibrutinib treatment of TCL1-AT mice results in cell-intrinsic resistance development.
A Experimental design and treatment schedule of in vivo assay. Created in BioRender. Zapatka, M. (2025) https://BioRender.com/a06v191. B Absolute numbers of CD45+CD5+CD19+ cells in the peripheral blood from mice adoptively transferred with malignant splenocytes isolated from leukemic Eµ-TCL1 mice (TCL1-AT; first treatment round). Mice were randomized 2 weeks post-transplantation ( = week 0) when tumor load was >5000 in the peripheral blood and treatment was started (black arrow) with vehicle (V, n = 14) or ibrutinib (I, n = 12). ∗∗∗p = 0.0003. C, D Percentages of Ki67-positive cells out of CD5+CD19+ cells in peripheral blood (PB), spleen (SPL), bone marrow (BM), and inguinal lymph nodes (LN) from TCL1-AT mice treated with vehicle (V, n = 6, gray bars) or ibrutinib (I, n = 6, blue bars) for one week (left), or three weeks for vehicle (V, n = 6) and six weeks for ibrutinib (I, n = 3) (right). PB: ns = 0.1842; SPL: ns = 0.7919; BM: ∗p = 0.0256; LN: ∗∗p = 0.0062, ∗∗∗∗p < 0.0001. Absolute numbers of CD45+CD5+CD19+ cells in peripheral blood of mice injected with vehicle-treated tumors (E) or ibrutinib-resistant tumors (F) and treated with vehicle or ibrutinib (second treatment round); ns = 0.2712, ∗∗∗∗p < 0.0001. Group sizes: V_V (light blue): n = 10, V_I (dark blue): n = 10, I_V (light green): n = 7, I_I (dark green): n = 6. Animals were sacrificed when reaching the moribund status (red arrows). Data in C and D are mean ± SD and were analyzed by two-tailed unpaired Student’s t test.
Fig. 2
Fig. 2. Ibrutinib resistance is not driven by genetic mutations but likely related to post-translational modifications.
A Experimental design and treatment schedule of in vivo assay and overview of WES, RNA-sequencing and proteomic approaches on FACS-sorted murine CLL splenocytes. Created in BioRender. Zapatka, M. (2025) https://BioRender.com/a06v191. B RNA-sequencing of FACS-sorted murine CLL splenocytes. Unsupervised hierarchical clustering of the most variable transcripts comparing Ibr resistance (I-late, n = 3) vs Ibr sensitive (I-early, n = 4), and vehicle groups (V-late, n = 4 and V-early, n = 4) using LIMMA tool. C Over-representation analysis of significantly deregulated (FDR < 0.05) ibrutinib-resistant-specific transcripts showing enriched terms. D Venn diagram showing the overlap between robustly detected transcripts and identified proteins. E Heatmap visualization of matched pairs between transcripts found either significantly up- (up) or down-regulated (down) in ibrutinib-resistant samples and the respective proteins, and ranked by abundance in the ibrutinib-resistant proteome. F Over-representation analysis of transcripts up-regulated in ibrutinib-resistant mice and showing normalized protein abundance in log 2 higher than 0.5 (red) or lower than −0.5 (blue). Source data are provided as a Source Data file Fig. 2.
Fig. 3
Fig. 3. Proteome analysis of TCL1-CLL splenocytes suggests an altered proteasome activity in ibrutinib resistant tumors.
A Unsupervised hierarchical clustering of proteins reproducibly quantified in ibrutinib resistant (I-late, n = 4), ibrutinib sensitive (I-early, n = 4), and vehicle groups (V-late, n = 3 and V-early, n = 4) (n = 5495 proteins). Volcano plots display proteins significantly deregulated in ibrutinib-treated tumors vs vehicle-treated ones at late stage (B) or at early stage of disease (C) according to two-sided t test statistics (FDR < 0.05, S0 = 0.1). The main categories of proteins are represented by colors (yellow, KMT/KDM; green, ADP-ribosyl; blue, KAT/KDAC; violet, Ub-associated; orange, Proteasome). Representative proteins associated with either ubiquitin or proteasome are highlighted. D Selected protein clusters for significantly deregulated proteins in ibrutinib-resistant mice are shown, with the corresponding gene ontology signature. E Immunoblot analysis of K48-linkage specific polyubiquitination in PanB-enriched CLL splenocytes. Actin was used as loading control. Numbers indicate labels of mice. Experiment has been performed in triplicate and representative image is shown. Data are mean ± SD and were analyzed by two-tailed unpaired Student’s t test; 274 vs 271: ∗p = 0.0234; 274 vs 252: ∗p = 0.0253; 270 vs 271: ∗p = 0.0261; 270 vs 252: ∗p = 0.0268. Source data are provided as a Source Data file Fig. 3.
Fig. 4
Fig. 4. Both ibrutinib-resistant and -naive TCL1-CLL respond to carfilzomib treatment.
A Experimental outline of CFZ treatment in TCL1-AT mice. Created in BioRender. Zapatka, M. (2025) https://BioRender.com/a06v191. B C57BL/6 mice were injected with either ibrutinib-naïve (left panel) or -resistant (right panel) TCL1-CLL cells. Ibrutinib-naïve: ns = 0.0535; ∗p = 0.0227, ∗∗∗∗p < 0.0001. Ibrutinib-resistant: ns = 0.0586; ∗p = 0.0282, ∗∗∗∗p < 0.0001. Absolute number of CD19+ CD5+ TCL1-CLL cells in spleen (C) and in the inguinal lymph nodes (LN) (D). Spleen: ∗p = 0.0232; ∗∗∗p = 0.0005, ns = 0.9318, ∗∗∗p = 0.0003. LN: ns = 0.3279, ∗∗∗p = 0.0002, ∗∗∗∗p < 0.0001. Spleen (E) and liver (F) weights of mice 5 weeks after TCL1-CLL transplantation. n = 10 each group. Spleen weight: ∗p = 0.0155, ∗∗p = 0.0062, ∗∗∗p = 0.0010. Liver weight: ∗∗∗p = 0.0002, ns = 0.9772, ∗∗p = 0.0012. Mice treated with vehicle are represented by circular symbols, mice treated with CFZ are represented by squared symbols. Data are mean ± SD and were analyzed by two-tailed unpaired Student’s t test.
Fig. 5
Fig. 5. Proteome analysis of CFZ-treated TCL1-CLL reveals patterns specifically altered in ibrutinib resistant tumors.
A Unsupervised hierarchical clustering of proteins reproducibly quantified in ibrutinib-naïve and ibrutinib-resistant TCL1-CLL treated with CFZ or the corresponding vehicle (n = 3072). Z-scored protein abundances are shown. B Volcano plot display of proteins significantly deregulated in ibrutinib-resistant TCL1-CLL treated with CFZ (Res CFZ; n = 4) or vehicle (Res UT; n = 4) according to two-sided t test statistics (FDR < 0.05, S0 = 0.1). Main categories of proteins are represented by colors (pink, Stress/Cell death; orange, Proteasome; green, Ubiquitin; blue, PTM; red, upregulated transcription factors). Representative proteins associated with the above-mentioned categories are highlighted. C Over-representation analysis of significantly deregulated ibrutinib-resistant proteins treated with CFZ showing enriched terms. D GSEA of proteins represented in B (Resistant CFZ/Resistant UT) and ranked by t test statistics (top). Terms associated with proteins showing increased and decreased expression upon CFZ treatment are shown in red and orange, respectively. Enrichment plot for the downregulated ubiquitin ligase complex (bottom). Source data are provided as a Source Data file Fig. 5.
Fig. 6
Fig. 6. Complementary administration of CFZ improves survival of mice developing ibrutinib resistance.
A Absolute numbers of CD19+ CD5+ TCL1-CLL cells in PB of TCL1-AT mice undergoing ibrutinib (I, n = 8, purple square) or carfilzomib (CFZ, n = 10, green triangle) monotherapy, the combined therapy (I + CFZ, n = 9, red upside-down triangle) or the corresponding vehicle treatment (V, n = 8, gray circle) over time. Data are mean ± SD and were analyzed by Kruskal–Wallis test with Dunn´s multiple comparisons test; ∗∗p = 0.0025. B Kaplan–Meier curves of the overall survival of the TCL1-AT mice described in (A). Data were analyzed by Mantel-Cox test; CFZ vs I + CFZ: ∗p = 0.034, V vs I + CFZ: ∗p = 0.026. C Absolute numbers of CD19+ CD5+ TCL1-CLL cells in PB of mice under ibrutinib monotherapy (I, n = 14, purple square), the sequential administration of ibrutinib followed by CFZ (CFZ upon I, n = 15, orange rhombus) or the corresponding vehicle treatment (V, n = 6, gray circle) over time. Data are mean ± SD and were analyzed by one-way Anova with Tukey´s multiple comparison test (at 6 weeks) or with unpaired two-tailed Student’s t test (at 7, 8 and 9 weeks); ∗∗p = 0.0016, ∗∗∗p = 0.0001, ∗∗p = 0.0039, ∗∗∗∗p < 0.0001. D Kaplan–Meier curves of the overall survival of TCL1-AT mice described in C. Data were analyzed by Mantel-Cox test;∗∗p = 0.0027, ∗∗∗∗p < 0.0001.
Fig. 7
Fig. 7. Commonly deregulated trends in ibrutinib-resistant CLL patients revealed by proteome analysis.
A Multi-scatterplot showing the Pearson’s correlation analysis of proteome data (n = 2840 proteins) between ibrutinib-resistant samples of the TCL1-AT mouse model (Ms.1–4, n = 4) and human ibrutinib-resistant samples with wild-type (wt, n = 2) or mutant (mut, n = 5) BTK. Pearson correlation coefficient as a measure of the strength of the linear relationship of the proteome of two samples each, is reported in blue. Orange dots represent proteasome-related proteins (n = 35). B Boxplot representation of Pearson’s correlation coefficients between murine ibrutinib-resistant samples (n = 4) and human resistant samples with wild-type (BTKwt, n = 2) or mutant BTK (BTKmut, n = 5), for either all matched proteins, or proteins in specific complexes. Number of proteins: All proteins (n = 2840), Proteasome (n = 35), Euk tr. init. factor (n = 23), SWI/SNF (n = 9), MAPK (n = 8), Mitochon. (n = 24), Ribosome (n = 86). Center lines show the medians; box limits indicate the 25th and 75th percentiles; whiskers extend 1.5 times the interquartile range from the 25th and 75th percentiles. C Heatmap visualization of the unsupervised clustering of log2 protein abundance for human BTKwt or BTKmut CLL samples at either untreated (UT, n = 6) or ibrutinib-resistant (RES, n = 9) disease stage. TMT1 and TMT2 refer to two different sample batches. D Unsupervised hierarchical clustering of the significantly deregulated proteins in at least two out of three human CLL samples. Blue and pink clusters correspond to significantly down- and up-regulated proteins, respectively, in all three resistant samples in comparison with the other two conditions. E Venn diagram depicting the number of robustly quantified proteins across the three patients, the amount of significantly deregulated proteins and the ones specifically associated with resistance. Line plot display of significantly deregulated proteins in ibrutinib-resistant CLL patients (n = 3) are shown (F), with the corresponding gene signatures (G). Blue and pink clusters correspond to significantly down- and up-regulated proteins, respectively, in all three resistant samples in comparison with the other two conditions. H Intensity-based ranking distribution of relapse (REL, n = 3) over during treatment (DT, n = 3) average ratio expressed in log2. Proteins with log2 FC of at least ±0.5 (represented by dotted lines) are highlighted. Ubiquitin ligases and proteasome-associated proteins are shown in violet and orange, respectively. Heatmap representation of ubiquitin ligases (I) and proteasome-associated proteins (J) across the three treatment stages: before treatment (BT, n = 3), during treatment (DT, n = 3), and at relapse (REL, n = 3). K CellTiter-Glo luminescent cell viability assay performed after 72 h exposure to proteasome inhibitors (in triplicate). Graph shows average +/- standard deviation (SD). Experiment was performed on cells from three treatment nave patients (CLL163, CLL177, CLL187) and one ibrutinib-resistant patient (OMZPo113). Source data are provided as a Source Data file Fig. 7.

References

    1. Nabhan, C. & Rosen, S. T. Chronic lymphocytic leukemia a clinical review. Jama312, 2265–2276 (2014). - PubMed
    1. Hallek, M. Chronic lymphocytic leukemia: 2015 Update on diagnosis, risk stratification, and treatment. Am. J. Hematol.90, 446–460 (2015). - PubMed
    1. Jain, N. & O’Brien, S. Initial treatment of CLL: integrating biology and functional status. Blood126, 463–470 (2015). - PMC - PubMed
    1. Robak, P., Drozdz, I., Szemraj, J. & Robak, T. Drug resistance in multiple myeloma. Cancer Treat. Rev.70, 199–208 (2018). - PubMed
    1. Nass, J. & Efferth, T. Drug targets and resistance mechanisms in multiple myeloma. Cancer Drug Resistance1, 87–117 (2018).

MeSH terms

LinkOut - more resources