. 2025 Jan 25;16(1):1026.
doi: 10.1038/s41467-025-56085-5.

CHD6 has poly(ADP-ribose)- and DNA-binding domains and regulates PARP1/2-trapping inhibitor sensitivity via abasic site repair

Affiliations

CHD6 has poly(ADP-ribose)- and DNA-binding domains and regulates PARP1/2-trapping inhibitor sensitivity via abasic site repair

Luc Provencher et al. Nat Commun. .

Abstract

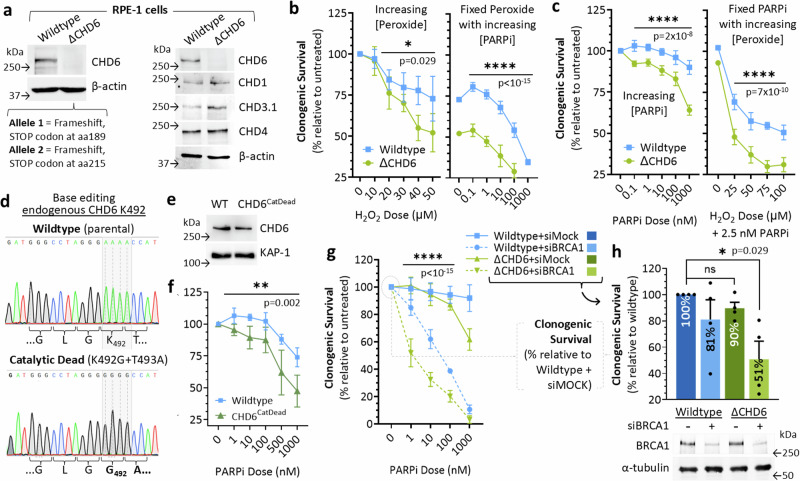
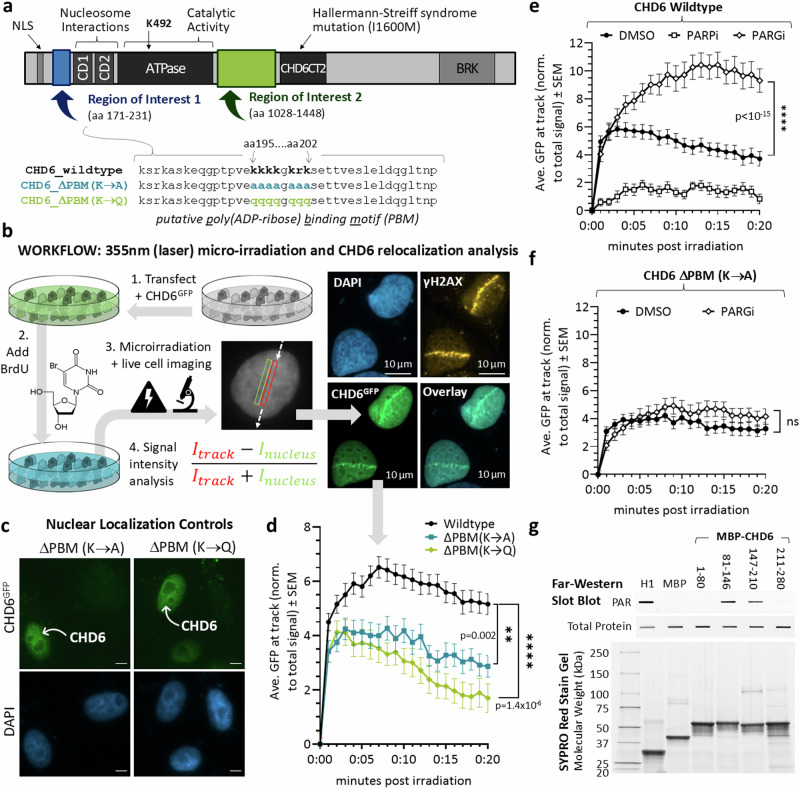
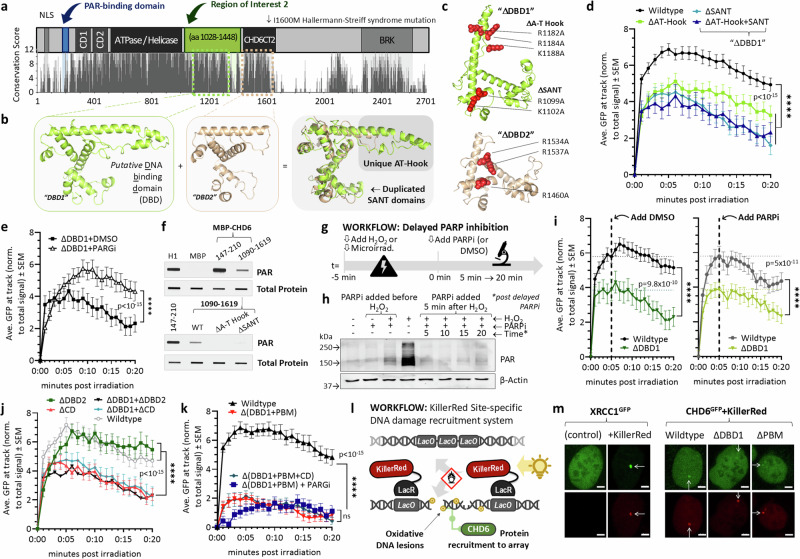
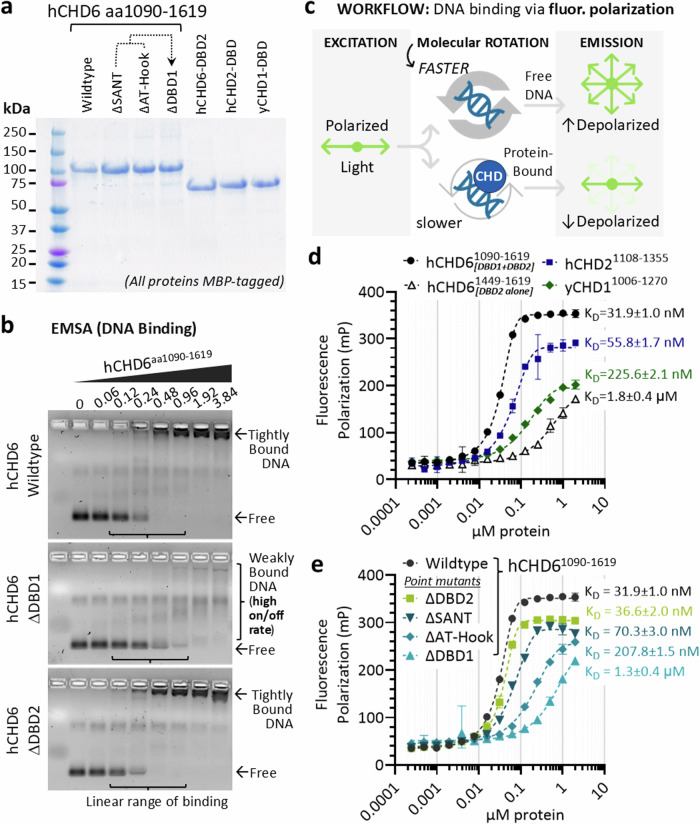
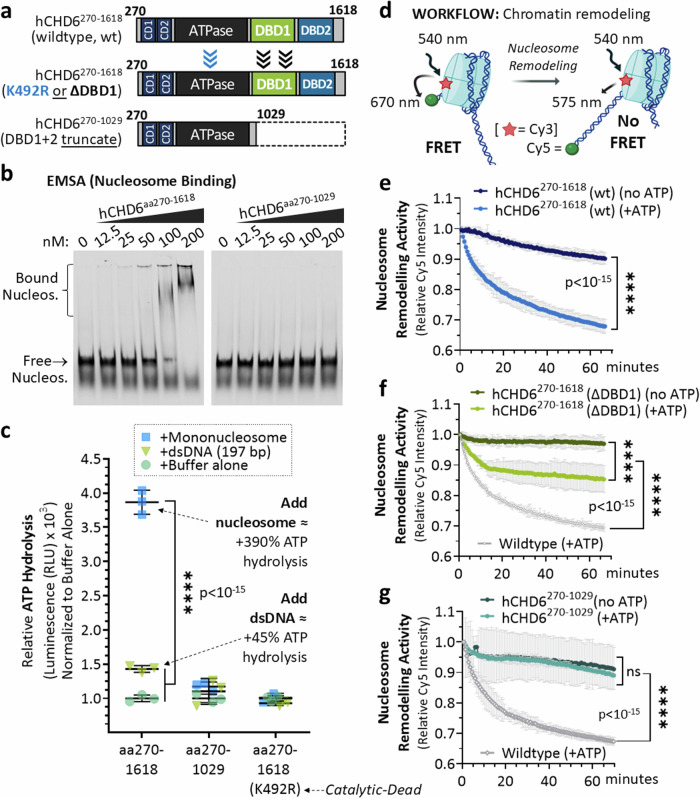
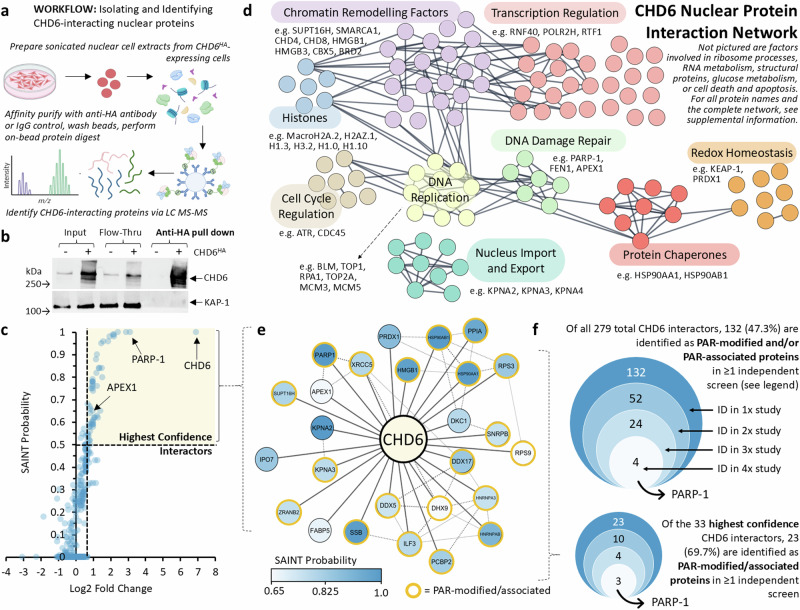
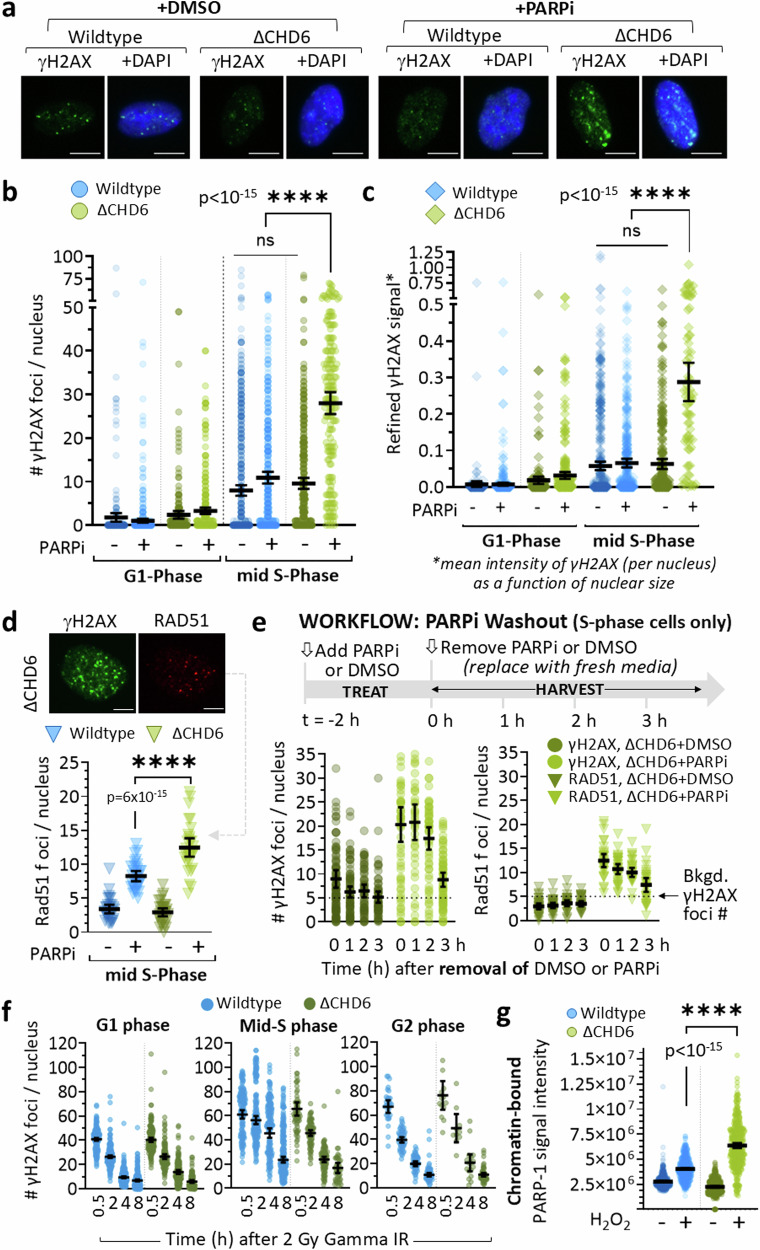
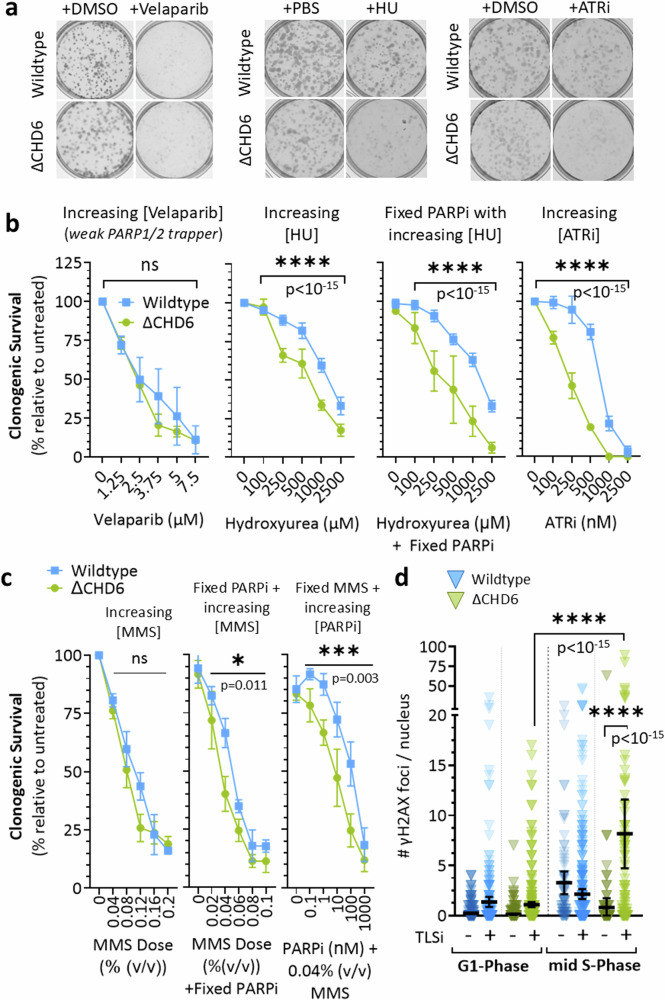
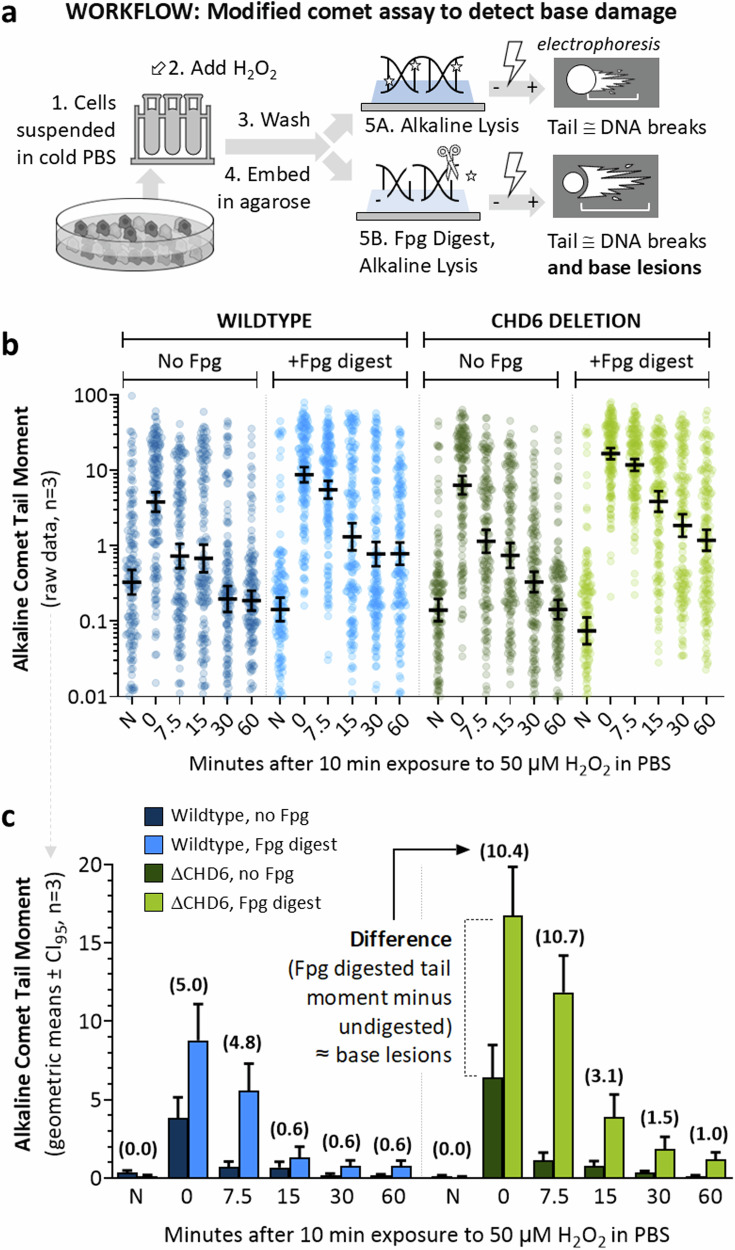
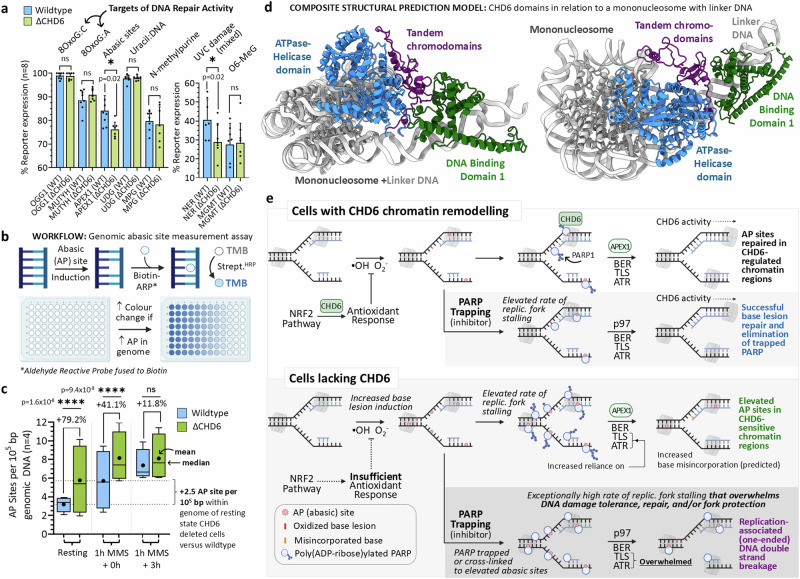
To tolerate oxidative stress, cells enable DNA repair responses often sensitive to poly(ADP-ribose) (PAR) polymerase 1 and 2 (PARP1/2) inhibition-an intervention effective against cancers lacking BRCA1/2. Here, we demonstrate that mutating the CHD6 chromatin remodeler sensitizes cells to PARP1/2 inhibitors in a manner distinct from BRCA1, and that CHD6 recruitment to DNA damage requires cooperation between PAR- and DNA-binding domains essential for nucleosome sliding activity. CHD6 displays direct PAR-binding, interacts with PARP-1 and other PAR-associated proteins, and combined DNA- and PAR-binding loss eliminates CHD6 relocalization to DNA damage. While CHD6 loss does not impair RAD51 foci formation or DNA double-strand break repair, it causes sensitivity to replication stress, and PARP1/2-trapping or Pol ζ inhibitor-induced γH2AX foci accumulation in S-phase. DNA repair pathway screening reveals that CHD6 loss elicits insufficiency in apurinic-apyrimidinic endonuclease (APEX1) activity and genomic abasic site accumulation. We reveal APEX1-linked roles for CHD6 important for understanding PARP1/2-trapping inhibitor sensitivity.


Conflict of interest statement

Competing interests: The authors declare no competing interests.

Figures

Fig. 1
Fig. 1. CHD6 loss or introduction of a catalytic site mutation sensitizes cells to PARP1/2-trapping inhibitors and/or depletion of BRCA1.
For all statistical analysis in this figure, 2-way ANOVAs followed by Tukey post hoc tests were carried out. ns = not significant (p > 0.05), *p < 0.05. ** p < 0.01. ***p < 0.001.****p < 0.0001. Source data are provided as a Source Data file. All clonogenic survival assay line graphs represent data normalized to untreated wildtype controls as arithmetic means ± SEM. In all cases, wildtype data are indicated in blue, while CHD6 negative data are in green. Panel a RPE1 were subjected to CRISPR/Cas9-mediated CHD6 gene deletion (ΔCHD6) and immunoblotted for indicated proteins. Panel b WT and ΔCHD6 cells were treated with increasing peroxide (left) or 50 µM H2O2 in PBS and/or increasing doses of the PARPi Olaparib in media (right), then scored for colony formation 7 days later. All data is normalized relative to DMSO alone, n = 6. Panel c WT and ΔCHD6 RPE-1 cells were plated and treated with increasing PARPi (left) or 2.5 nM PARPi and increasing H2O2. All data is normalized relative to DMSO alone; n = 6. Panel d Sequencing outcomes of successful CRISPR base editing of endogenous CHD6 (in RPE-1 cells) to introduce K492G + T493A = Catalytic Dead = “CHD6CatDead”. Panel e Immunoblot of CHD6 and loading control KAP-1 in RPE-1 expressing WT CHD6 and mutant from (d). Panel f WT and CHD6CatDead-expressing cells were treated with increasing PARPi then scored for colony formation 7 days later; n = 3. Panel g WT and ΔCHD6 RPE-1 cells were transfected with siRNA against BRCA1 or a scrambled control (siMock) and, 3 days later, treated with PARPi as in (d) and scored for colony formation; n = 3. Data in line graph is normalized relative to DMSO alone (with **** reflecting 2-way ANOVA comparisons of all lines relative to one another). Panel h Bar charts of resting state normalized to the WT RPE-1 transfected with siMOCK; error bars represent SEM, with statistical analysis being Mann-Whitney t-tests. n = 4. Immunoblot of BRCA1 is shown below to confirm siRNA efficacy.
Fig. 2
Fig. 2. The CHD6 N-terminus contains a PAR-interacting motif needed for relocalization to DNA damage.
For all statistical analysis in this figure, 2-way ANOVAs followed by Tukey post hoc tests were carried out. ns = not significant (p > 0.05), *p < 0.05. ** p < 0.01. ***p < 0.001.****p < 0.0001. Source data are provided as a Source Data file. All line graphs of microirradiation data are means normalized to t = 0 min, ± SEM, and full statistical test outcomes are in Supplemental Table 1. Panel a Schematic of CHD6 domains illustrating nuclear localization signal (NLS), tandem chromodomains (CD1 + 2), catalytic subunit (ATPase), SANT, BRK domain, two regions of interest, and Hallerman-Streiff syndrome mutation domain (CHD6CT2). Sequence alignment of putative PAR-binding motif (PBM) and corresponding mutants. Panel b Workflow of laser micro-irradiation and analysis; this figure was created using Microsoft PowerPoint. Panel c Nuclear localization controls for CHD6ΔPBM (K→A)-GFP and CHD6ΔPBM (K→Q)-GFP. Panel d Cells expressing GFP-tagged CHD6ΔPBM (K→A) and CHD6ΔPBM (K→Q) were micro-irradiated, imaged over 20 minutes, and analyzed as in (b); n = 18-30. Panel ef Cells expressing GFP-tagged wildtype or CHD6ΔPBM (K→A) were treated with DMSO, 2.5 nM PARPi or 5 μM PARG inhibitor (PARGi) for 1 h prior to micro-irradiation, imaged and quantified as in (b); n = 15–30. Panel g Purified, maltose binding protein (MBP)-tagged CHD6 fragments were slot-blotted on a nitrocellulose membrane and probed with 100 nM purified PAR. PAR binding was detected with the anti-PAR antibody 10H. Histone H1 and MBP were used as positive and negative PAR binding controls, respectively, while Sypro Ruby stain visualized all blotted proteins as a loading control. A Sypro Ruby stained SDS-PAGE of all proteins used in slot blot assay is shown below slot blots.
Fig. 3
Fig. 3. The central SANT and AT-hook of CHD6 comprises a putative DNA binding domain important for PAR-responsive CHD6 localization to DNA damage.
For all statistical analysis in this figure, 2-way ANOVAs followed by Tukey post hoc tests were carried out. ns = not significant (p > 0.05), *p < 0.05. ** p < 0.01. ***p < 0.001.****p < 0.0001. Source data are provided as a Source Data file. All line graphs of microirradiation data are means normalized to t = 0 min, ± SEM, and full statistical test outcomes are in Supplemental Table 1. Panel a Schematic of CHD6 domains and corresponding conservation score determined by Jalview 2.10 (per). Panel b Structural models of Region of Interest 2 (green, referred to as DBD1) and ‘CHD6CT2’ (beige, referred to as DBD2) of CHD6 based on homology modeling to S. cerevisiae CHD1, with superposition (right) to emphasize overlapping SANT domains and unique AT-hook structure in DBD1. Panel c Models mapping DBD1 and DBD2 mutations. Panel d Cells expressing mutants from (c) were micro-irradiated, imaged over 20 minutes; n = 30. Panel e Cells expressing wildtype or ΔDBD1 CHD6 were exposed to DMSO or 5 μM PARGi for 1h before micro-irradiation; n = 30. Panel f Purified, maltose binding protein (MBP)-tagged CHD6 fragments were slot-blotted, probed with 100 nM purified PAR and immunoblotted for PAR. Histone H1 and MBP were used as positive and negative controls, respectively. Panel g Workflow for delayed PARP (or DMSO) inhibition experiment. Panel h Cells were exposed to PARPi and/or H2O2, then immunoblotted for PAR and actin. Panel i Cells expressing wildtype and CHD6 ΔDBD1 were treated with DMSO or 2.5 nM PARPi per the workflow in (g), and analyzed as in Fig. 2b; n = 30. Panels jk Cells expressing wildtype or indicated mutants were assayed for micro-irradiation relocalization; n = 28–30. For panel k, CHD6 ΔDBD1 + ΔPBM was additionally treated with 5 μM PARGi for 1 h prior to micro-irradiation and analyzed as in Fig. 2b; n = 18–30. Panel l Schematic of KillerRed DNA damage recruitment assay. Panel m: mCherry-tagged KillerRed was induced in U2OS 2-6-3 cells expressing indicated proteins and imaged for mCherry (red) and GFP (green).
Fig. 4
Fig. 4. CHD6 possesses direct DNA binding activity.
For all statistical analysis in this figure, 2-way ANOVAs followed by Tukey post hoc tests were carried out. ns = not significant (p > 0.05), *p < 0.05. ** p < 0.01. ***p < 0.001.****p < 0.0001. Source data are provided as a Source Data file. Panel a. Coomassie stain of indicated MBP-tagged purified proteins. Panel b. Increasing amounts of hCHD6 aa 1090-1619 wildtype, ΔDBD1 or ΔDBD2 point mutants were incubated with double-stranded DNA and resolved by electrophoretic mobility shift assay (EMSA). Please note that we attribute the absence of a discrete DNA complex band in the highest concentrations of ΔDBD1 (despite loss of free probe signal) to the overall weak but still measurable affinity of ΔDBD1 for DNA (compared to WT and ΔDBD2) that results in a less stable complex with a higher off-rate causing free probe signal to smear across the middle section of the gel at higher concentrations, rather than form a discrete band. Panel c Workflow for fluorescence polarization-based DNA binding assay. Panel d MBP-fused proteins from (a) were titrated into fluorescently labelled double-stranded DNA and resulting change in depolarization was measured; fluorescence polarization line graphs show geometric means ± CI95%; n = 3. Dissociation constants (KD) were determined by fitting the data to a logistic function and identifying the point on the model with the largest change in fluorescence polarization. Panel e Wildtype and indicated point mutants of hCHD6 aa 1090-1619 (from a) were assayed as in (d); graph shows geometric means ± CI95%; n = 3.
Fig. 5
Fig. 5. CHD6 DNA binding activity is essential for ATP-dependent nucleosome remodeling.
For all statistical analysis in this figure, 2-way ANOVAs followed by Tukey post hoc tests were carried out. ns = not significant (p > 0.05), *p < 0.05. ** p < 0.01. ***p < 0.001.****p < 0.0001. Source data are provided as a Source Data file. Panel a. Schematic of wildtype and point mutants of hCHD6 aa 270-1618, as well as the hCHD6 aa270-1029 truncation mutant lacking both DBD1 and DBD2 entirely. Panel b Ability of indicated proteins from (a) to bind mononucleosomes (147 bp DNA around the histone octamer and 50 bp linker DNA) was assessed by EMSA. Panel c ATP hydrolysis assay with proteins from (a) in presence or absence of free double-stranded DNA (dsDNA) or mononucleosomes from (b); centre lines of ATP assay data represent arithmetic means ± SD; n = 3. Panel d. Workflow for chromatin remodeling assay; this figure was created with Biorender.com (agreement number UO268HP0OZ) and Microsoft PowerPoint. Panel eg Wildtype CHD6 and indicated mutants (from a) were assayed with and without ATP using chromatin remodeling assay outlined in (d). All FRET data line graphs are geometric means ± CI95%; n = 3.
Fig. 6
Fig. 6. The nuclear CHD6 interactome is highly enriched for PAR-modified and PAR-associated proteins.
For all statistical analysis in this figure, 2-way ANOVAs followed by Tukey post hoc tests were carried out. ns = not significant (p > 0.05), *p < 0.05. ** p < 0.01. ***p < 0.001.****p < 0.0001. Source data are provided as a Source Data file. Panel a Workflow used for identification of interacting partners of CHD6; this figure was created using Biorender (https://BioRender.com/i42e687) and Microsoft PowerPoint. Panel b CHD6HA was transfected into HEK293T, immunoprecipitated from nuclear cells extracts, and immunoblotted for CHD6 to confirm IP efficacy (with KAP-1 used as a loading control); this data is representative of three biological replicates. Panel c SAINT scores of all identified CHD6-interacting proteins and compared to their fold enrichment above IgG controls. Panel d Partial network of proteins identified exclusively in CHD6HA IP or that exhibited a spectral count fold change > 2 compared to IgG controls. Protein hits were filtered for spectral count > 3 across three biological replicates and nuclear localization using the STRING database. Connections between protein hits are based on physical interactions annotated in the STRING database. See Supplemental Information for complete network and all protein names. Panel e. Network of the highest confidence interacting proteins of CHD6 (highlighted by yellow shading in (c). High confidence hits were determined based on a minimum fold change of 2 (dashed line) and SAINT score of 0.5. Annotated interactions from the BioGRID database are also shown. Nodes with yellow borders indicate known targets of PARP1 activity or proteins that interact with PAR-modified substrates. Panel f. Stacked Venn diagrams illustrate the number of proteins identified in the CHD6 nuclear interactome that also were listed as significant in four published screens identifying substrates for PARylation or PAR-interactors.
Fig. 7
Fig. 7. PARPi triggers an S-phase specific accumulation of γH2AX and RAD51 in CHD6-deleted cells, which display highly functional DNA double strand break repair.
For all statistical analysis in this figure, 2-way ANOVAs followed by Tukey post hoc tests were carried out. ns = not significant (p > 0.05), *p < 0.05. ** p < 0.01. ***p < 0.001.****p < 0.0001. All experiments are n = 3, centre lines of all foci data graphs are arithmetic means ± CI95%. Source data are provided as a Source Data file. Panel a Logarithmically dividing WT and ΔCHD6 cells were treated with 2.5 µM PARPi or DMSO for 1h and immunostained for γH2AX and DAPI. Images are representative of cells in mid S-phase based on relative DAPI signal. Scale bars = 5 µm. Panel b For the experiment described in (a), γH2AX foci per nucleus for cells in either G1 or mid S-Phase were enumerated. Panel c For the experiment described in (a), refined γH2AX signal (that accounts for γH2AX focal intensity, focal number, and nuclear volume) in either G1 or mid S-Phase was measured. Panel d S-phase cells from (b) were immunostained for γH2AX and RAD51, and enumerated for the arithmetic mean number of RAD51 foci per nucleus; n = 3. Representative images are from PARPi-treated ΔCHD6 S-phase cells. Scale bars = 5 µm. Panel e Logarithmically dividing ΔCHD6 RPE-1 cells were incubated in media with 2.5 mM PARPi or an equal volume of DMSO for 2h, then placed into fresh media and harvested immediately (0h), or after another 1, 2, and 3h. Cells were immunostained for γH2AX and RAD51, and enumerated as in (b, d). Panel f Logarithmically dividing WT and ΔCHD6 RPE-1 cells were irradiated with 2 Gy gamma ray ionizing radiation (IR), fixed between 0.5-24h later, and immunostained for γH2AX and DAPI. Graphs are γH2AX foci per nucleus for cells predominantly in (left to right) G1-phase, S-phase, or G2-phase. Panel g Logarithmically dividing WT and ΔCHD6 cells were treated with 50 µM H2O2 (or PBS), detergent extracted, immunostained for PARP-1, imaged and quantified for nuclear PARP-1 signal; n = 3.
Fig. 8
Fig. 8. CHD6-deletion causes hypersensitivity to replication stress.
For all statistical analysis in this figure, 2-way ANOVAs followed by Tukey post hoc tests were carried out. ns = not significant (p > 0.05), *p < 0.05. ** p < 0.01. ***p < 0.001.****p < 0.0001. Source data are provided as a Source Data file. All clonogenic survival assay line graphs represent data normalized to untreated wildtype controls as arithmetic means ± SEM. Panel a WT and ΔCHD6 RPE-1 cells were plated and treated either with 7.5 μM Veliparib or an equal volume of DMSO, 500 μM hydroxyurea (HU) versus an equal volume of PBS buffer, or 500 nM ATR inhibitor (ATRi) or an equal volume of DMSO, or 2.5 nM PARPi with and without 1 nM camptothecin (CPT), and scored for colony formation 6 days later. Panel b Quantified clonogenic survival data from (a) for WT and ΔCHD6 RPE-1 cells treated with increasing doses of Veliparib, HU or a fixed dose of 2.5 nM PARPi and increasing doses of HU, or increasing doses of ATRi. Panel c WT and ΔCHD6 RPE-1 cells treated with increasing doses of methyl methane-sulfonate (MMS), a fixed dose of 2.5 nM PARPi with increasing MMS, or a fixed dose MMS with increasing PARPi. Panel d Logarithmically dividing WT and ΔCHD6 RPE-1 cells were treated with 1 µM TLSi or an equal volume of DMSO for 1 h, immunostained for γH2AX and DAPI, with centre line of all foci data graphs represent arithmetic mean γH2AX foci per nucleus for cells in either G1 or mid S-Phase ± CI95%; n = 3.
Fig. 9
Fig. 9. CHD6-deletion causes increased Fpg-enzyme sensitive base damage persistence following H2O2 exposure.
For all statistical analysis in this figure, 2-way ANOVAs followed by Tukey post hoc tests were carried out. ns = not significant (p > 0.05), *p < 0.05. ** p < 0.01. ***p < 0.001.****p < 0.0001. Source data are provided as a Source Data file. Panel a A workflow for Fpg-modified and standard alkaline comet assay; this figure was created using Microsoft PowerPoint. Panel b. WT and RPE-1ΔCHD6 in suspension were treated with 50 µM H2O2 and analyzed by Fpg-modified and standard alkaline comet assay, with scatters representing raw data from three independent experimental repeats and centre lines representing geometric means ± CI95%; n = 3. Panel c Geometric means and 95% confidence intervals from (b) were expressed as a bar chart representing, showing the differences between standard and Fpg-modified comet assay tail moments as numbers in parentheses above each time point.
Fig. 10
Fig. 10. Loss of CHD6 reduces cellular base excision repair capacity to resolve apurinic/apyrimidinic (AP) sites, leading to AP site accumulation within genomic DNA.
Source data are provided as a Source Data file. Panel a Wildtype and CHD6-deleted cells were analyzed by fluorescence multiplex host cell reactivation (as in refs. ) using reporter plasmids that monitor resolution of the indicated base excision repair substrates. Bar graph data are geometric means ± CI95%; n = 8. 2-way ANOVAs followed by Tukey post hoc tests were carried out between WT and ΔCHD6, with ns = not significant (p > 0.05), and * representing p = 0.0198 for abasic site and p = 0.0197 for UV substrate. Panel b Workflow for the ELISA assay monitoring apurinic/apyrimidinic (AP) sites present within genomic DNA; figure was created using Biorender (https://BioRender.com/y64d242) and Microsoft PowerPoint. Panel c Wildtype and CHD6 cells were treated ± 0.04% (v/v) MMS for 1 h and either harvested immediately (0 h) or placed into fresh media for 3 h and allowed to recover, before being analyzed as in (b). Data are represented as 5–95 percentile box and whisker plots for n = 4. Black dots in middle of plot represent arithmetic means, centre lines represent medians, and + % values represent relative increase in AP sites per 105 bp in CHD6-deleted cells relative to wildtype. 2-way ANOVAs followed by Tukey post hoc tests were carried out. ns = not significant (p > 0.05),****p < 0.0001. Panel d A composite structural prediction of the arrangement of the CHD6 functional domains in relation to a mononucleosome with linker DNA (light grey), with CHD6 tandem chromodomains shown in purple, the ATPase-Helicase motor domain in blue, and the DBD1 (SWISS-MODEL) in green and the nucleosome template in grey (PDB ID 5O9G). Panel e A model for the molecular circumstances leading to PARPi-induced synthetic lethality with CHD6 loss; this figure was created using Biorender (https://BioRender.com/j29p818) and Microsoft PowerPoint.

References

    1. Jaramillo, M. C. & Zhang, D. D. The emerging role of the Nrf2-Keap1 signaling pathway in cancer. Genes Dev.27, 2179–2191 (2013). - PMC - PubMed
    1. Thanan, R. et al. Oxidative stress and its significant roles in neurodegenerative diseases and cancer. Int J. Mol. Sci.16, 193–217 (2014). - PMC - PubMed
    1. Rouleau-Turcotte, E. & Pascal, J. M. ADP-ribose contributions to genome stability and PARP enzyme trapping on sites of DNA damage; paradigm shifts for a coming-of-age modification. J. Biol. Chem.299, 105397 (2023). - PMC - PubMed
    1. Gibbs-Seymour, I., Fontana, P., Rack, J. G. M. & Ahel, I. HPF1/C4orf27 Is a PARP-1-interacting protein that regulates PARP-1 ADP-ribosylation activity. Mol. Cell62, 432–442 (2016). - PMC - PubMed
    1. Hendriks, I. A. et al. The regulatory landscape of the human HPF1- and ARH3-dependent ADP-ribosylome. Nat. Commun.12, 5893 (2021). - PMC - PubMed

MeSH terms

Substances

LinkOut - more resources