. 2025 Jan 25;16(1):1033.
doi: 10.1038/s41467-025-56380-1.

The α-globin super-enhancer acts in an orientation-dependent manner

Affiliations

The α-globin super-enhancer acts in an orientation-dependent manner

Mira T Kassouf et al. Nat Commun. .

Erratum in

  • Author Correction: The α-globin super-enhancer acts in an orientation-dependent manner.
    Kassouf MT, Francis HS, Gosden M, Suciu MC, Downes DJ, Harrold C, Larke M, Oudelaar M, Cornell L, Blayney J, Telenius J, Xella B, Shen Y, Sousos N, Sharpe JA, Sloane-Stanley J, Smith AJH, Babbs C, Hughes JR, Higgs DR. Kassouf MT, et al. Nat Commun. 2025 Mar 19;16(1):2714. doi: 10.1038/s41467-025-58071-3. Nat Commun. 2025. PMID: 40108171 Free PMC article. No abstract available.

Abstract

Individual enhancers are defined as short genomic regulatory elements, bound by transcription factors, and able to activate cell-specific gene expression at a distance, in an orientation-independent manner. Within mammalian genomes, enhancer-like elements may be found individually or within clusters referred to as locus control regions or super-enhancers (SEs). While these behave similarly to individual enhancers with respect to cell specificity, distribution and distance, their orientation-dependence has not been formally tested. Here, using the α-globin locus as a model, we show that while an individual enhancer works in an orientation-independent manner, the direction of activity of a SE changes with its orientation. When the SE is inverted within its normal chromosomal context, expression of its normal targets, the α-globin genes, is severely reduced and the normally silent genes lying upstream of the α-globin locus are upregulated. These findings add to our understanding of enhancer-promoter specificity that precisely activate transcription.


Conflict of interest statement

Competing interests: J.R.H. is a founder and shareholder of Nucleome Therapeutics; J.R.H., and D.J.D. are paid consultants for Nucleome Therapeutics. J.R.H. holds patents for NG Capture-C. Patent applicant: Oxford University Innovation Limited, Name of inventor(s): James R Hughes and James Davies nos. WO2017068379A1, EP3365464B1 and US10934578B2. Specific aspect of manuscript covered in patent application: NG-Capture C experiments. These authors declare no other financial or non-financial interests. The remaining authors declare no competing interests.

Figures

Fig. 1
Fig. 1. The erythroid systems and mouse models developed and analysed in this study.
a Top, solid black and red bars represent the α-globin TAD and sub-TAD respectively. RefSeq and coordinates (mm9) chr11:32,080,000–32,250,000 bp. Below, CTCF occupancy (ChIP-seq) and open chromatin (ATAC-seq) profiles in primary erythroid cells (with the ‘mouse’ graphic) derived from the definitive and primitive lineages as well as EB-derived erythroid cells (with ‘a cell in a dish’ graphic). b Top box contains schematics representing (i) the wildtype α-globin locus with arrows marking the embryonic (ζ) and adult α-globin genes (α) (in red) and flanking genes (Nprl3, Mpg, Rhbdf1, Snrnp25, in grey) and pointing in the direction of their expression. Orange box represents the SE: red bars mark the enhancers (R1, R2), blue bars the facilitators (R3, Rm, R4). Purple arrows indicate the CTCF-binding sites, the arrow direction represents the CTCF site orientation, and the α-globin tested boundary elements labelled HS3839. The grey shaded area highlights the region inverted in this study. Schematics represent (ii) R1 deletion mutant (red cross, (ΔR1), (iii) R1 deletion (red cross) and R2 inversion (inverted black arrow) mutant (ΔR1-R2INV), (iv) HS3839 boundary deletion mutant (black cross, ΔCTCF). Dashed grey arrow indicates the natural orientation of the SE pointing towards the α-globin genes. The lower box contains the inversion models (SEINV) as indicated by the dashed grey arrow pointing away from α-globin genes and towards Rhbdf1 and Snrnp25 genes. (v) With the exception of the orientation of the grey-shaded area, and the colour of the arrows representing changes in levels of expression (orange indicating down regulation of the α-globin genes and red arrows indicating upregulation of Rhbdf1 and Snrnp25), the annotation of the elements remains the same as in (i). (vi) The SEINV model harbouring the HS3839 CTCF boundary deletion (black cross) and red arrow indicating Mpg gene upregulation (SEINV-ΔCTCF). (vii) The SEINV-ΔCTCF model harbouring Mpg gene knock-out (second black cross, SEINV-ΔCTCF-ΔMpg). Black stars (WT*, ΔCTCF*, SEINV*) indicate the models in which Mpg gene was also deleted and analysed (ΔMpg, ΔCTCF-ΔMpg, SEINV-ΔMpg). Graphics of ‘cell in a dish’ and ‘mouse’ represent mESC in vitro culture and in vivo mouse models respectively. Red stars indicate mouse models previously published.
Fig. 2
Fig. 2. The inversion of the major α-globin enhancer (R2) has no detectable effect on the locus.
a Top, RefSeq gene annotation. ATAC-seq tracks show chromatin accessibility profiles in erythroid cells derived from wildtype (WT, grey track) and R1 enhancer deletion (ΔR1) mESC models (blue track). Note the absence of the peak corresponding to R1 on the blue track, highlighted with a shaded blue bar. SE schematics as in Fig. 1 (i, ii, iii). ATAC-seq track for the ΔR1-R2INV (green) indicates deletion of R1 (shaded blue bar) and intact open chromatin over the inverted enhancer R2 (shaded green bar). b Gene expression analysis by real-time qPCR assessing levels of mRNA for Nprl3, CD71, pb4.2 as controls for the analysed erythroid population, as well as the α-globin genes (adult Hba-a1/2 and embryonic Hba-x), relative to the embryonic β-like globin gene (Hbb-h1) and normalised to WT. Independent erythroid differentiation experiments were analysed for each genetic model; biological replicates WT n = 3, ΔR1 n = 4, ΔR1-R2INV n = 6. Error bars indicate the standard deviation (SD) and black dots represent individual data points. Statistical analysis was performed using two-way ANOVA and Tukey post-hoc test: ****p < 0.0001, ***p < 0.001, ns: non-significant. Source data including statistical analysis is available in the Source Data file.
Fig. 3
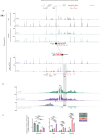
Fig. 3. Perturbed SE interactions and surrounding genes’ expression profiles in SEINV EB-derived erythroid cells.
a Top, RefSeq gene annotation. Below, normalised (reads per kilobase per million mapped reads, RPKM) and averaged read-densities from 3 independent experiments of ATAC-seq and CTCF ChIP-seq show open chromatin and CTCF occupancy in EB-derived erythroid cells differentiated from WT and SEINV mESCs. For the annotated schematics, refer to Fig. 1i and v. The purple shaded bar indicates the position of CTCF boundary elements (HS3839) in WT- and SEINV-derived erythroid cells. b NG Capture-C interaction profiles in WT (grey) and SEINV (orange) EB-derived erythroid cells show normalised and averaged interacting fragment count using a 6 kb window (n = 3 independent biological replicates). Additional track shows subtraction (SEINV-WT) per DpnII fragment of significantly interacting fragments using DESeq2 (p.adj<0.05) with light orange for reduced interactions and dark orange for increased interactions in SEINV-derived erythroid cells. The dashed black arrows indicate the direction of the SE in both WT and SEINV models. The star marks the viewpoint (the R1 enhancer) used in the NG Capture-C experiment. c Gene expression analysis by real-time qPCR assessing levels of mRNA for controls Nprl3, CD71, pb4.2, and Mpg, Rhbdf1, and Snrnp25 genes, as well as the α-globin genes (Hba-a1/2 and Hba-x) relative to the embryonic β-like globin gene (Hbb-h1) and normalised to WT. Independent erythroid differentiation experiments were analysed for each genetic model; biological replicates n = 3. Error bars indicate the standard deviation (SD) and black dots represent individual data points. Statistical analysis was performed using two-way ANOVA and Sidak multiple comparisons test: ****p < 0.0001, ns: non-significant. Source data including statistical analysis is available in the Source Data file.
Fig. 4
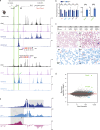
Fig. 4. SEINV perturbs gene expression and chromatin interactions at the α-globin locus and causes an α-thalassemia phenotype in a mouse model.
a Top, RefSeq gene annotation. Normalised (RPKM) and averaged read-densities of ATAC-seq, CTCF, H3K4me3 and H3K27me3 ChIP-seq (n = 3) in Ter119+ spleen-derived definitive erythroid cells from both WT and SEINV mice. For the annotated schematics, refer to Fig. 2i and v. The purple shaded bar indicates the position of CTCF (HS3839) in WT- and SEINV-derived erythroid cells. b Gene expression analysis as in Fig. 3c except: for the α-globin gene expression, the ratio of adult α-globin to adult β-globin is calculated (α/β). Three mice per genotype were analysed, n = 3. **p < 0.009, ns: non-significant. An unpaired t-test was performed on Rhbdf1 and Snrnp25 data: ***p < 0.0005, ****p < 0.0001. c Top, hematological parameters of red cells: Red Blood Cell (RBC) count, Hemoglobin measurement (HGB), Mean Corpuscular Volume (MCV, fL), Mean Corpuscular Hemoglobin (MCH, g dl−1), the reticulocyte percentage (retic%), the spleen weight as a percentage of body weight (Spleen%) for WT and homozygous SEINV mice. Statistical analysis was performed using one-way ANOVA with a Tukey post-hoc test: red star for p < 0.0001. Below, blood films (upper panels) and Brilliant Cresyl Blue (BCB)-stained blood (lower panels) from WT and homozygous SEINV mice are shown. Abnormal red blood cells, characteristic of α-thalassemia, indicated by coloured arrows. Red: spiky cell membrane (acanthocytes), green: small and round cell (spherocyte), purple: target cells, blue: poorly hemoglobinized (hypochromic) cells, and red arrow-heads for immature erythroid cells (reticulocytes). d MA (log ratio (M) versus average (A)) plot of RNA-seq data derived from WT and SEINV primary definitive erythroid cells (n = 3). Mean RNA abundance is plotted on the x-axis and enrichment is plotted on the y-axis. Green dots: significantly upregulated genes (Rhbdf1, Snrnp25) in the SEINV and blue dots for controls (Nprl3 and Mpg), unaffected by the SE inversion. e NG Capture-C interaction profiles in WT (navy) and SEINV (blue) show means (n = 3) of interacting fragment count using a 6 kb window. Additional track shows subtraction (SEINV-WT) per DpnII fragment of significantly interacting fragments using DESeq2 (p.adj<0.05); light pink for reduced interactions and dark pink for increased interactions in SEINV-derived erythroid cells. Dashed black arrows indicate the SE direction. Star marks the viewpoint (the R1 enhancer). Source data including statistical analysis is available in the Source Data file.
Fig. 5
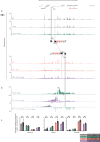
Fig. 5. Deletion of the 5’ α-globin CTCF boundary element (HS3839) in SEINV mESC model does not rescue the SEINV phenotype in in vitro EB-derived erythroid cells.
a Top, RefSeq gene annotation. Normalised (reads per kilobase per million mapped reads, RPKM) and averaged read-densities (n = 3) of ATAC-seq and CTCF ChIP-seq in EB-derived erythroid cells differentiated from WT, ΔCTCF and SEINV-ΔCTCF mESCs. For the annotated schematics, refer to Fig. 1i, iv, and vi. The purple shaded bar indicates the position of CTCF boundary element (HS3839) in WT, ΔCTCF and SEINV-ΔCTCF erythroid cells. b NG Capture-C profiles in ΔCTCF (green) and SEINV-ΔCTCF (purple) show means (n = 3) of interacting fragment as in Fig. 4e. Subtraction track shows light green for reduced interactions and dark green for increased interactions in SEINV-ΔCTCF erythroid cells. The grey shaded area, encompassing the Mpg gene located between the SE and the α-globin genes in the SEINV models, indicates the increased interactions at the newly positioned Mpg in the SEINV-ΔCTCF. c Gene expression analysis by real-time qPCR assessing levels of mRNA for controls Nprl3, CD71, pb4.2, as well as Mpg, Rhbdf1, and Snrnp25, and the α-globin (Hba-a1/2 and Hba-x) relative to the embryonic β-like globin gene (Hbb-h1) and normalised to WT. Independent erythroid differentiation experiments were analysed for each genetic model; biological replicates n = 3. Error bars indicate the standard deviation (SD) and black dots represent individual data points. Statistical analysis was performed using two-way ANOVA and Sidak multiple comparisons test: ****p < 0.0001, ***p < 0.001, **p < 0.005, *p < 0.05. Source data including statistical analysis is available in the Source Data file.
Fig. 6
Fig. 6. Deletion of the Mpg gene in SEINV and ΔCTCF mESC models does not rescue the SEINV model phenotypes in in vitro EB-derived erythroid cell.
a Top, RefSeq gene annotation. Normalised (RPKM) and averaged read-densities (n = 3) of ATAC-seq and CTCF ChIP-seq in EB-derived erythroid cells differentiated from mESCs models with native SE configuration and deletion of CTCF or/and Mpg promoter: WT, ΔMpg, ΔCTCF-ΔMpg, and mESCs models with inverted SE combined with the deletions of CTCF and Mpg: SEINV, SEINV-ΔMpg, SEINV-ΔCTCF, and SEINV-ΔCTCF-ΔMpg. For the annotated schematics, refer to Fig. 1i and v. The purple shaded bar indicates the position of CTCF boundary element (HS3839) in WT- and SEINV -derived erythroid cells. b NG Capture-C interaction profiles in ΔCTCF-ΔMpg (green) and SEINV-ΔCTCF-ΔMpg (purple) show means of interacting fragment counts (n = 3) as in Fig. 4e. Subtraction track shows reduced and increased interactions (light and dark green respectively) in SEINV-ΔCTCF-ΔMpg erythroid cells. The grey shaded bar indicates Mpg gene, located between the SE and the α-globin genes in the SEINV models. c Gene expression analysis for the α-globin gene (Hba-a1/2) as well as Rhbdf1, and Snrnp25 relative to the embryonic β-like globin gene (Hbb-h1) and normalised to WT. Independent erythroid differentiation experiments were analysed for each genetic model; biological replicates n = 3. Error bars indicate the standard deviation (SD) and black dots represent individual data points. Statistical analysis was performed using two-way ANOVA and Sidak multiple comparisons test: ns: non-significant. Source data including statistical analysis is available in the Source Data file.
Fig. 7
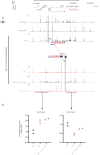
Fig. 7. Rad21 ChIP at the α-globin locus in erythroid cells derived from WT, SEINV, and SEINV-ΔCTCF-ΔMpg mESC models shows a cohesin distribution pattern that mirrors the SE sequence and functional orientation.
a RPKM-normalised ATAC-seq and CTCF ChIP-seq tracks for WT EB-derived erythroid cells for orientation. Below, representative RPKM-normalised Rad21 ChIP-seq tracks for WT, SEINV and SEINV-ΔCTCF-ΔMpg EB-derived erythroid cells. ATAC-seq track for SEINV EB-derived erythroid cells for orientation. The schematic represents the WT (top) versus the SEINV-ΔCTCF-ΔMpg (below) configurations. The grey and purple highlighted areas indicate the Mpg gene and HS3839 CTCF sites respectively. b Rad21 ChIP read counts in two independent populations of erythroid cells derived each from WT, SEINV, and SEINV-ΔCTCF-ΔMpg in vitro differentiated mESCs, n = 2. Data shown for the regions 5’ and 3’ of the inverted SE and marked by a black line below the SEINV ATAC-seq track. The plots show the two replicates per genotype represented in two same-coloured dots. Reads are normalised to the average number of reads over a selected region in the β-globin locus.
Fig. 8
Fig. 8. A model based on a comparison of the engineered ΔCTCF-ΔMpg and SEINV-ΔCTCF-ΔMpg α-globin loci.
a The α-globin locus as presented in RefSeq. Below, a schematic representation highlighting the key elements within the cluster including enhancers (red bars), facilitators (blue bars), and promoters (black bars). CTCF-bound insulators are represented by purple arrow heads pointing in the direction representing the orientation of the N-terminal domain of CTCF. HS3839 is the functional 5’ α-globin sub-TAD boundary. b The two engineered loci in which both the HS3839 insulators and the Mpg gene have been removed from the wild-type locus (ΔCTCF-ΔMpg) and the locus in which the SE has been inverted (SEINV-ΔCTCF-ΔMpg). In both configurations, the SE would be expected to form a transcriptional hub: grey dashed ovals containing a graphical representation of the enhancer-like elements making contact and relevant transcription factors and co-factors are enriched (coloured varying size ovals). Nevertheless, the pattern of gene expression in the associated sub-TAD is still determined by the orientation of the SE (bold grey curved arrows). Weaker expression and interactions are represented by the light grey bold curved arrow. The predominant direction of chromatin interactions, determined by NG Capture-C and associated enrichment of cohesin (Rad21) is shown by dashed line arrows and follows the SE orientation.

References

    1. Grosveld, F., van Staalduinen, J. & Stadhouders, R. Transcriptional Regulation by (Super)Enhancers: From Discovery to Mechanisms. Annu. Rev. Genom. Hum. Genet. 10.1146/annurev-genom-122220-093818 (2021). - PubMed
    1. Long, H. K., Prescott, S. L. & Wysocka, J. Ever-Changing Landscapes: Transcriptional Enhancers in Development and Evolution. Cell167, 1170–1187 (2016). - PMC - PubMed
    1. Banerji, J., Olson, L. & Schaffner, W. A lymphocyte-specific cellular enhancer is located downstream of the joining region in immunoglobulin heavy chain genes. Cell33, 729–740 (1983). - PubMed
    1. Banerji, J., Rusconi, S. & Schaffner, W. Expression of a β-globin gene is enhanced by remote SV40 DNA sequences. Cell27, 299–308 (1981). - PubMed
    1. Schaffner, W. Enhancers, enhancers – from their discovery to today’s universe of transcription enhancers. Biol Chem396, 311–327 (2015). - PubMed

LinkOut - more resources