. 2025 Jan 25;16(1):1017.
doi: 10.1038/s41467-025-56305-y.

Fast single atom imaging for optical lattice arrays

Affiliations

Fast single atom imaging for optical lattice arrays

Lin Su et al. Nat Commun. .

Abstract

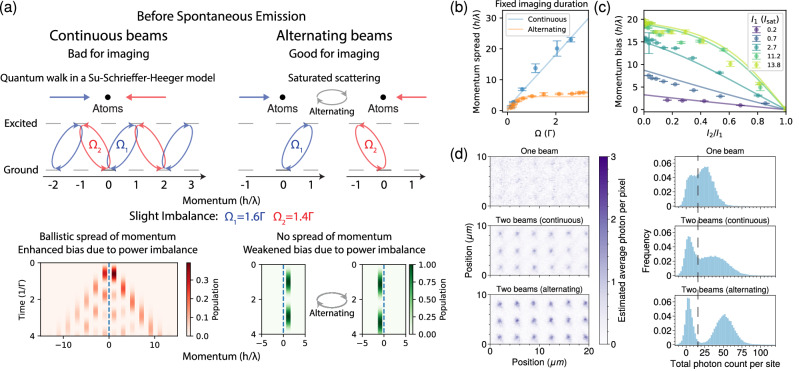
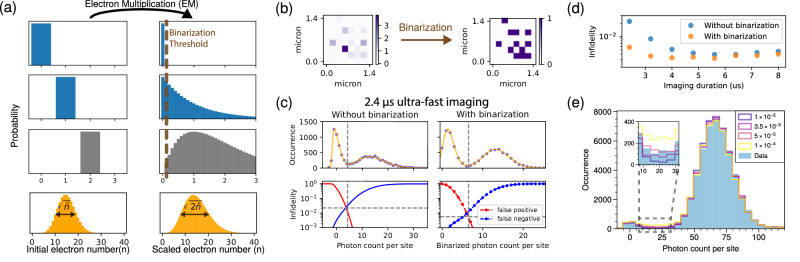
High-resolution fluorescence imaging of ultracold atoms and molecules is paramount to performing quantum simulation and computation in optical lattices and tweezers. Imaging durations in these experiments typically range from a millisecond to a second, significantly limiting the cycle time. In this work, we present fast, 2.4 μs single-atom imaging in lattices, with 99.4% fidelity - pushing the readout duration of neutral atom quantum platforms to be close to that of superconducting qubit platforms. Additionally, we thoroughly study the performance of accordion lattices. We also demonstrate number-resolved imaging without parity projection, which will facilitate experiments such as the exploration of high-filling phases in the extended Bose-Hubbard models, multi-band or SU(N) Fermi-Hubbard models, and quantum link models.


Conflict of interest statement

Competing interests: M.G. is a cofounder and shareholder of QuEra Computing. All other authors declare no competing interests.

Figures

Fig. 1
Fig. 1. Imaging setup.
a Our quantum gas microscope consists of a high-resolution objective mounted in vacuum. To perform imaging, we send two counter-propagating beams onto the atoms and set the beam polarization and atom quantization axis to maximize the objective collection efficiency (SI). b we expand the lattice spacing to a few micrometers to perform fast fluorescence imaging in free space without cooling or trapping and obtain single-shot images. c is one such image with a Mott Insulator in the center and checkerboard patterns on the edge—a signature of dipolar interactions between the magnetic atoms used in our quantum gas microscope.
Fig. 2
Fig. 2. Alternating pulsed imaging beams result in high imaging fidelity.
The spread and bias of atom momentum can reduce imaging fidelity. To prevent atoms from accelerating in one direction, we apply two counter-propagating beams to average momentum kicks. However, when both beams simultaneously illuminate at high intensity (I ≈ 20Isat), we observe rapid spatial spreading due to coherent quantum walks between spontaneous emission events. This process quickly spreads the atomic wave function across many momentum states. For times t ≲ 1/Γ, the dynamics can be approximated by coherent oscillations in the highly saturated regime (IIsat), which explains key features of the observed behavior. Simulations of the excited state population reveal that the quantum walk causes the momentum to spread over tens of k states (left of a), with excited state population shown in red. In contrast, with alternating beams, the momentum remains confined to ±k (right of a), with excited state population shown in green before spontaneous emission. As a result, the atomic motion during imaging is primarily governed by a diffusive random walk from spontaneous emission events. In b, we simulate the momentum spread after multiple spontaneous emissions using the master equation (SI). For a fixed imaging duration, the momentum spread increases linearly with beam intensity when using two continuous beams while it plateaus with alternating beams, even at higher intensities. Experimental time-of-flight measurements show good agreement with these simulations (solid lines), with error bars representing the standard error of the mean throughout this paper. c displays the measured momentum bias and simulated results (solid lines) for continuous beams, highlighting the increased sensitivity to intensity imbalance with simultaneous beams. Finally, (d) compares averaged images with one beam on (top), both beams on continuously (middle), and alternating beams with no overlap (bottom) at the same total imaging duration. The alternating beam configuration yields sharper images with better separation of histogram peaks, consistent with theoretical predictions.
Fig. 3
Fig. 3. Imaging with alternating beams.
With alternatingly pulsed beams, the stochastic recoil causes atoms to spread out when the imaging duration is increased, as simulated in the upper panel of (a), where colors represent different simulated traces. To compare the experiment with the simulation, we measure the spot size of our atoms. b is an exemplary image averaged over 30 single-shot images where we expand the accordion lattices to 6 μm spacing and perform free space imaging for 7.2 μs. The image is slightly asymmetric since the beams are along one direction and our objective has aberrations especially when the atom randomly walks out of the focal plane. The image is then cropped into individual sites and 1D profiles are obtained by summing over either the x or y axis. The x and y spot sizes are different since the imaging beams are along only one axis and the objective aberrations are anisotropic (SI). The spot sizes with different accordion lattice spacings and imaging durations are shown in (c). The measured spot sizes of the x and y profiles are plotted with circles with error bars. The respective colored lines correspond to the simulated spot size along the x and y directions. The measurements qualitatively agree with the simulation.
Fig. 4
Fig. 4. Ultra-fast high-fidelity imaging via binarization of Electron Multiplying (EM) CCD counts.
EM noise on the EM CCD camera can negatively affect the signal-to-noise ratio (a). Pixels with 0, 1, or 2 initial electrons (left top 3 panels) are amplified via EM, resulting in overlapping probability distributions that make it impossible to precisely distinguish the initial electron number (right top 3 panels). Assuming a Poisson distribution of the initial electron number (left lowest panel in orange), the EM process results in a factor of two more variance (right lowest panel in orange). However, when the photon density per pixel is less than one (the blue panels dominate) setting a binarization threshold (brown dashed line) to each camera pixel enables a near-perfect distinction between 0 and 1 initial electrons. This effectively removes the EM noise and increases the signal-to-noise ratio. An example of binarization is shown in (b), where only 15 photons are collected on the camera within 2.4 μs (3 μm accordion lattice spacing). The histograms are fitted with two skew-normal distributions and a constant offset between the peaks to account for the branching ratio in (c). The infidelity at different cutoffs is estimated based on the fit, assuming the overlapping distributions are accurate representations of the probability distribution in the tails. Binarization increases the estimated fidelity from 97.7% to 99.4% on our EM CCD camera. The maximum fidelity of more than 99.5% can be achieved with only 3 μs imaging duration as shown in (d). The fidelity is mainly limited by the atom transitioning into a dark state during imaging, which we estimate in (e) by preparing a cloud with mostly one atom per site and then performing imaging for 8.8 μs at 4 μm accordion lattice spacing. In addition to two peaks corresponding to 0 and 1 atom per site, we identify significant counts between the peaks with this long imaging duration. The simulated histograms assuming different branching ratios are laid on top of the data, showing an estimated branching ratio of slightly below 5 × 10−5.
Fig. 5
Fig. 5. Parity-projection-free imaging.
A single-shot image of more than one particle per site is shown in (a). The histogram of the data and the simulation (no free parameters except the peak heights) shows good agreement in (b). The fidelity from the simulation is labeled on top of the graph. In 700 digitized single-shot images, we select three different representative sites with average fillings of 1, 2, and 3 atoms per site, and plot the histogram of the atom number in (c). The Poisson distribution is overlaid in solid lines to contrast the sub-Poissonian statistics we observed, qualitatively showing that we are in the Mott Insulator regime.

References

    1. Jaksch, D., Bruder, C., Cirac, J. I., Gardiner, C. W. & Zoller, P. Cold bosonic atoms in optical lattices. Phys. Rev. Lett.81, 3108 (1998).
    1. Greiner, M., Mandel, O., Esslinger, T., Hänsch, T. W. & Bloch, I. Quantum phase transition from a superfluid to a Mott insulator in a gas of ultracold atoms. Nature415, 39 (2002). - PubMed
    1. Gross, C. & Bakr, W. S. Quantum gas microscopy for single atom and spin detection. Nat. Phys.17, 1316 (2021).
    1. Altman, E. et al. Quantum simulators: architectures and opportunities. PRX Quantum2, 017003 (2021).
    1. Daley, A. J. et al. Practical quantum advantage in quantum simulation. Nature607, 667 (2022). - PubMed

LinkOut - more resources