. 2025 Jan 25;16(1):40.
doi: 10.1038/s41419-024-07312-2.

Ferroptosis triggers mitochondrial fragmentation via Drp1 activation

Affiliations

Ferroptosis triggers mitochondrial fragmentation via Drp1 activation

Lohans Pedrera et al. Cell Death Dis. .

Abstract

Constitutive mitochondrial dynamics ensure quality control and metabolic fitness of cells, and their dysregulation has been implicated in various human diseases. The large GTPase Dynamin-related protein 1 (Drp1) is intimately involved in mediating constitutive mitochondrial fission and has been implicated in mitochondrial cell death pathways. During ferroptosis, a recently identified type of regulated necrosis driven by excessive lipid peroxidation, mitochondrial fragmentation has been observed. Yet, how this is regulated and whether it is involved in ferroptotic cell death has remained unexplored. Here, we provide evidence that Drp1 is activated upon experimental induction of ferroptosis and promotes cell death execution and mitochondrial fragmentation. Using time-lapse microscopy, we found that ferroptosis induced mitochondrial fragmentation and loss of mitochondrial membrane potential, but not mitochondrial outer membrane permeabilization. Importantly, Drp1 accelerated ferroptotic cell death kinetics. Notably, this function was mediated by the regulation of mitochondrial dynamics, as overexpression of Mitofusin 2 phenocopied the effect of Drp1 deficiency in delaying ferroptosis cell death kinetics. Mechanistically, we found that Drp1 is phosphorylated and activated after induction of ferroptosis and that it translocates to mitochondria. Further activation at mitochondria through the phosphatase PGAM5 promoted ferroptotic cell death. Remarkably, Drp1 depletion delayed mitochondrial and plasma membrane lipid peroxidation. These data provide evidence for a functional role of Drp1 activation and mitochondrial fragmentation in the acceleration of ferroptotic cell death, with important implications for targeting mitochondrial dynamics in diseases associated with ferroptosis.


Conflict of interest statement

Competing interests: The authors declare no competing interests. Ethics approval and consent to participate: All methods were performed in accordance with the relevant guidelines and regulations concerning good scientific practice. The study did not require ethical approval as it did not include live vertebrates or human participants.

Figures
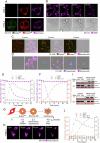
Fig. 1
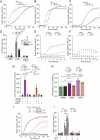
Fig. 1. Ferroptosis induces mitochondrial fragmentation and depolarization but not mitochondrial outer membrane permeabilization.
A Live cell confocal images of NIH-3T3 cells labeled with Bodipy C-11 [1 µM] and Mitotracker [50 nM] ± RSL3 treatment [2 µM] for 2 h. Scale bar, 10 µm. B Time-lapse confocal images of NIH-3T3 cells treated with RSL3 [2 µM] and monitored for loss of TMRE staining [200 nM]. Scale bar, 20 µm. C, D Time-lapse Incucyte images of HT-1080 cells treated with RSL3 [0.5 µM] and labeled using Bodipy C-11 [1 µM] and MitoView 650 [50 nM] in c or CytotoxGreen staining [250 nM] and MitoView 650 staining [50 nM] in (D). Scale bars in (C, D), 100 µm. E Kinetics of increase in lipid peroxidation and decrease in MitoView 650 positive cells after RSL3 [0.5 µM] treatment in the presence or absence of Fer-1 [2 µM], calculated from experiments as shown in (C). F Kinetics of increase in CytotoxGreen staining and decrease in MitoView 650 positive cells after RSL3 [0.5 µM] treatment ± Fer-1 [2 µM], calculated from experiments as shown in (D). G Graphical representation of the sequence of events observed in HT-1080 cells following RSL3-induced ferroptosis. t50 of each phenotypic event was calculated from the mean curves shown in (E, F). These values correspond to the time at 50% of the maximum signal. H Time-lapse confocal microscopy images of Smac-mCherry cellular localization during ferroptosis induction in NIH-3T3 cells treated with RSL3 [1 µM]. Scale bar, 20 µM. I HT-1080 cells were treated with DMSO (control) or RSL3 [1 µM] for 3 h. Cells were lyzed and separated into cytosolic and mitochondrial fractions. The indicated proteins were detected by Western blotting. J Time course of increase in oxidized Bodipy C-11 and CytotoxGreen uptake in HT-1080 cells treated with RSL3 [0.5 µM] in the presence or absence of MitoQ [0.5 µM] or Fer-1 [2 µM]. Images are representative of at least three independent experiments each performed at least in triplicates throughout. Values in (E, F, J) represent the mean of at least three independent experiments ± STDEV.
Fig. 2
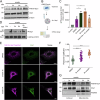
Fig. 2. Drp1 accelerates ferroptotic cell death.
Control or drp1−/−MEFs were treated with A RSL3 [0.5 µM], B erastin [10 µM] or C cysteine starvation in the presence of Draq7 [3 µM] for the indicated time. Dead cells were quantified as Draq7 positive cells using Incucyte live cell imaging. D Control or drp1FL/FL MEFs cells were infected with Adenoviral-Cre for 24 h. The indicated cells were subsequently treated with DMSO or erastin [10 µM] for 16 h. % Propidium iodide (PI) positive cells were quantified by flow cytometry. Representative immunoblots of the used cells (insert). Wild-type MEFs were subjected to mock or Drp1-targeting siRNA for 72 h followed by treatment with E erastin [10 µM] or F RSL3 [1 µM]. Dead cells were quantified as Draq7 positive cells using Incucyte live cell imaging. G wild-type MEFs ± Drp1 knockdown as in (E, F) were treated with erastin [10 µM] and/or DFO [10 µM]. Dead cells were quantified as Draq7 positive cells normalized to cell confluence using Incucyte live cell imaging. H wild-type MEFs ± Drp1 knockdown as in (E, F) were treated with erastin [10 µM] or RSL3 [1 µM] in the presence of STY-BODIPY [1 µM] for 4 h and imaged using the Incucyte live cell imaging system. The ratio of oxidized STY-Bodipy (STY-Bodipyox) to reduced STY-Bodipy (STY-Bodipyred) is shown. I Control or Drp1 knockout (KO) MEFs were transiently transfected with mitofusin 2-ADH (Mfn2-ADH) for 24 h and subsequently treated with RSL3 [0.5 µM] in the presence of Draq7 [3 µM] for the indicated time and imaged using the Incucyte live cell imaging. J wild-type or Mitofusin-2 Knockout (mfn2−/−) MEFs were subjected to mock or Drp1-targeting siRNA for 72 h followed by treatment with RSL3 [1 µM] and/ or Fer-1 [1 µM]. Dead cells were quantified as Draq7 positive cells using Incucyte live cell imaging. All graphs represent means ± STDEV or ±SEM of at least three independent experiments each performed at least in triplicates throughout. Ordinary one-way ANOVA and multiple comparisons test. ****p < 0.0001, ***p < 0.001, **p < 0.01, *p < 0.05.
Fig. 3
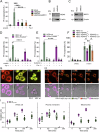
Fig. 3. Drp1 is activated and recruited to mitochondria upon induction of ferroptosis.
A A549 cells were treated with erastin [10 µM] for the indicated time, lyzed and subjected to Western blotting. B schematic illustration of experimental setup in (C, D). C, D A549 cells were pre-treated with Mdivi-1 [75 µM] for 24 h followed by additional treatment with erastin [10 µM] for the indicated time points followed by immunoprecipitation of Drp1 and C GTPase activity assay with one part and D Western blotting of another part. E Confocal images of A549 labeled with Mitotracker [150 nM] and co-stained with Drp1-Antibody, ±erastin treatment [10 µM] for the indicated time points. Scale bar, 10 µm. F quantification of colocalization of Drp1 and mitochondria using Pearson’s coefficient. Images were analyzed using ImageJ and Jacob Plugin. Pearson’s coefficient values are plotted. Every dot represents a single cell quantified. G representative immunoblots of isolated mitochondria and their respective cytosolic fraction of A549 cells after treatment with erastin [10 µM] for the indicated time points. Images are representatives of at least three independent experiments. Data represent means from three independent experiments ±STDEV. Ordinary one-way ANOVA + multiple comparisons test. ****p < 0.0001, ***p < 0.001, **p < 0.01, *p < 0.05.
Fig. 4
Fig. 4. Mitochondrial Drp1 recruitment accelerates ferroptotic cell death.
A A549 cells were subjected to mock or MiD49- and/or MiD51-targeting siRNAs for 72 h followed by erastin treatment [10 µM] for 24 h. Cell death was quantified by propidium iodide (PI) uptake and flow cytometry. B, C Representative Western blots are shown. Wild type and PGAM5−/− HEK cells were subjected to (D) erastin [10 µM] or (E) cysteine starvation ± Fer-1 treatment [1 µM] for 24 h. Cell death was determined as in (A). F Wild type and PGAM5−/− HEK cells or PGAM5−/− HEK cells containing a doxycycline-inducible PGAM5-expression plasmid (WT or H105A) were subjected to doxycycline treatment [100 nM] for 24 h followed by erastin treatment [10 µM] for 24 h and cell death analysis using PI staining. G Time lapse live cell confocal images of wt and H drp1−/− MEFs labeled with BODIPY-C11 [1 µM] and Mitotracker Deep Red [150 nM], and treated with RSL3 [4 µM]. Scale bar, 20 µm. The upper panel shows merged color channels: oxidized BODIPY-C11 in green and non-oxidized BODIPY-C11 in red. The lower panel displays Mitotracker Deep red fluorescence and bright field images of the equatorial focus plane. I Quantification of the oxidation ratio (Bodipyox/(Bodipyox + Bodipyred)) in wt (n = 10 cells) and drp1−/− MEFs (n = 16 cells), scatter box plot displays the interquartile range (IQR) and median oxidation ratio. Points beyond 1.5 times IQR are considered outliers. Values in (a, df) represent the mean of three independent experiments each performed at least in duplicates ± STDEV. Statistical test: Two-way ANOVA + Tukey’s multiple comparison test. ****p < 0.0001, ***p < 0.001, **p < 0.01, *p < 0.05.

References

    1. Dixon SJ, Lemberg KM, Lamprecht MR, Skouta R, Zaitsev EM, Gleason CE, et al. Ferroptosis: an iron-dependent form of nonapoptotic cell death. Cell. 2012;149:1060–72. https://pubmed.ncbi.nlm.nih.gov/22632970. - PMC - PubMed
    1. Tuo QZ, Lei P, Jackman KA, Li XL, Xiong H, Li XL, et al. Tau-mediated iron export prevents ferroptotic damage after ischemic stroke. Mol Psychiatry. 2017;22:1520–30. https://pubmed.ncbi.nlm.nih.gov/28886009/. - PubMed
    1. Li Y, Feng D, Wang Z, Zhao Y, Sun R, Tian D, et al. Ischemia-induced ACSL4 activation contributes to ferroptosis-mediated tissue injury in intestinal ischemia/reperfusion. Cell Death Differ. 2019;26:2284–99. https://pubmed.ncbi.nlm.nih.gov/30737476/. - PMC - PubMed
    1. Conrad M, Angeli JPF, Vandenabeele P, Stockwell BR. Regulated necrosis: disease relevance and therapeutic opportunities. 15, Nature Reviews Drug Discovery. Nature Publishing Group; 2016 [cited 2020 Oct 11]: [348–66 p]. Available from: https://pubmed.ncbi.nlm.nih.gov/26775689/. - PMC - PubMed
    1. Stockwell BR, Friedmann Angeli JP, Bayir H, Bush AI, Conrad M, Dixon SJ, et al. Ferroptosis: a regulated cell death nexus linking metabolism, redox biology, and disease. Cell. Cell Press. 2017;171:273–85. https://pubmed.ncbi.nlm.nih.gov/28985560/. - PMC - PubMed

LinkOut - more resources