. 2025 Jan 25;16(1):1024.
doi: 10.1038/s41467-025-56196-z.

Mathematical model linking telomeres to senescence in Saccharomyces cerevisiae reveals cell lineage versus population dynamics

Affiliations

Mathematical model linking telomeres to senescence in Saccharomyces cerevisiae reveals cell lineage versus population dynamics

Anaïs Rat et al. Nat Commun. .

Abstract

Telomere shortening ultimately causes replicative senescence. However, identifying the mechanisms driving replicative senescence in cell populations is challenging due to the heterogeneity of telomere lengths and the asynchrony of senescence onset. Here, we present a mathematical model of telomere shortening and replicative senescence in Saccharomyces cerevisiae which is quantitatively calibrated and validated using data of telomerase-deficient single cells. Simulations of yeast populations, where cells with varying proliferation capacities compete against each other, show that the distribution of telomere lengths of the initial population shapes population growth, especially through the distribution of cells' shortest telomere lengths. We also quantified how factors influencing cell viability independently of telomeres can impact senescence rates. Overall, we demonstrate a temporal evolution in the composition of senescent cell populations-from a state directly linked to critically short telomeres to a state where senescence onset becomes stochastic. This population structure may promote genome instability and facilitate senescence escape.


Conflict of interest statement

Competing interests: The authors declare no competing interests.

Figures
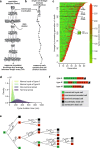
Fig. 1
Fig. 1. Principle of the mathematical model of replicative senescence.
Schematic representation of population (a) and single-cell lineage (b) experiments. c Experimental data of microfluidics experiments from. Display of consecutive cell cycle durations of lineages of a yeast strain harboring a subunit of telomerase under the control of a conditionally repressible promoter. Generation 0 corresponds to the moment from which telomerase is inactivated. Each horizontal line is an individual cell lineage, and each segment is a cell cycle. Cell cycle duration (in minutes) is indicated by the color bar on the right. Examples of type A or type B lineages are shown. d Kernel density smoothing representation of the distributions of the cell cycle durations for indicated cell types extracted from experimental data in (c) (see Supplementary Methods Fig. 1a). e Tree diagram of the mathematical model. It indicates the several fates of each cell type and respective probability rates, some being functions of the length of the shortest telomere in the cell . The colors of the squares indicate whether the cell cycle is normal (green) or abnormally long (red). f Three examples of lineages containing indicated type cells (A, B, or M). The colors of the squares are as in (e). Vertical or horizontal strips specify whether the cell cycles are terminal (never followed by a normal cell cycle) or not, respectively. Black or gray cells indicate the type of death.
Fig. 2
Fig. 2. Mathematical model of telomerase-deficient single lineages.
a Best fits of indicated probability rates as functions of the length of the shortest telomere . b Comparison between 1000 random simulations of the best-fit model of single lineages and experimental data expressed as generations of arrest classified by lineage type and type of arrest, as extracted from Fig. 1c and Supplementary Fig. 1b, c. nta: generation of the first non-terminal arrest; senA, senB: generation of first senescent arrest for type A or B cells; sen: generation of first senescent arrest for all types. Light blue area corresponds to 95% of 1000 simulations. c Simulated data of one microfluidics experiment with the best-fit mathematical model (parameters listed in Table 1). Other examples are shown in Supplementary Fig. 2a, b.
Fig. 3
Fig. 3. Mathematical model of telomerase-deficient populations.
a Average of 15 simulations of population growth as a function of time, as schematized in Fig. 1a, with best-fit parameters of Table 1 and each day an initial number of cells Ninit=1000, reaching a saturation number Nsat=rsatNinit, with rsat=1000. Light gray corresponds to extremum values envelope; light magenta area corresponds to 95% of the values. b Comparison between experimental data of telomerase-negative cells, taken from and simulations using the best-fit model with Ninit=300 and rsat=720, corresponding to the experimental conditions (dilution starting at OD600nm=0.0125 and reaching saturation at OD600nm9 after 24 h of growth in telomerase-positive conditions (see also Supplementary Fig. 3a). To match the experimental plots, simulated values are displayed at the same times as the experimental observations, i.e., once per day. Connecting lines correspond to the mean. Error bars of experimental values correspond to SD of 3 independent experiments. Error bars of simulated data correspond to SD of 30 independent simulations. c Comparison of the telomere length mode between the same experiments and simulations as in (b). Connecting lines correspond to the mean. Error bars of experimental values correspond to SD of 3 independent experiments. Error bars of simulated data correspond to SD of 30 independent simulations.
Fig. 4
Fig. 4. Temporal evolution of cell composition in telomerase-deficient populations.
a Temporal evolution of the generational age distribution of cells. Light gray corresponds to extremum values envelope; Light yellow area corresponds to 95% of the values. b Temporal evolution of the proportions of indicated cell categories in the whole population. Light gray corresponds to extremum values envelope; light magenta, gray or light orange areas corresponds to 95% of the values. c Temporal evolution of the proportion of type A or type B cells among the senescent population (entering the last set of prolonged cell cycles before cell death). d Distribution of the length of the shortest telomere in senescent cells for indicated cell types for each day. e Overall distribution of the length of the shortest telomere in senescent cells for indicated cell types.
Fig. 5
Fig. 5. Hidden parameters of telomerase-deficient populations that are experimentally inaccessible.
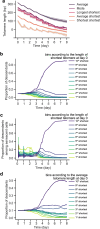
a Temporal evolution of indicated telomere length distribution features. Gray error bands represent the extremal values, while the other error bands encompass 95% of the values (+/− 97.5%/2.5% percentiles). b Proportion of descendant cells in the population based on the initial shortest telomere length of their ancestors prior to telomerase inactivation. c Same as (b) for senescent cells only. d Proportion of descendants based on the average telomere length of their ancestors prior to telomerase inactivation.
Fig. 6
Fig. 6. Effects on senescence rates from altering telomere length prior to telomerase inactivation.
Plot of the simulation of population growth (a, c) and linked average telomere length (b, d) as measured each 24 h, with best-fit parameters of Table 1 and each day an initial number of cells Ninit=1000, reaching a saturation number Nsat=rsatNinit, with rsat=1000. Half of the saturation limit (HSL) and relevant x-axis coordinates are indicated in red. a, b Effect of initial global telomere length distribution translation towards longer or shorter average telomeres on replicative senescence at the scale of populations. c, d Effect of altering positively or negatively the left side of telomere length distribution (the shorter telomeres). b, d Data are presented as mean values +/− SD.
Fig. 7
Fig. 7. Effects on senescence rates from altering telomere-independent spontaneous mortality rates (paccident).
Plot of the simulation of population growth (a) and linked average telomere length (b) as measured each 24 h, with best-fit parameters of Table 1 and each day an initial number of cells Ninit=1000, reaching a saturation number Nsat=rsatNinit, with rsat=1000. Half of the saturation limit (HSL) and relevant x-axis coordinates are indicated in red. b Data are presented as mean0 values +/− SD. c Proliferation of individual cell lineages of strains displaying indicated constant mortality rates (paccident) as simulated by single-lineage model, i.e. grown in the microfluidics device. Generation of senescence onset was ordered by lineage lifespan. Gray error bands represent the extremal values, while the other error bands encompass 95% of the values (+/− 97.5%/2.5% percentiles). d Median generation onset derived from (c) plotted as a function of increasing (paccident).
Fig. 8
Fig. 8. Major features of the temporal evolution of telomerase-deficient cell populations according to our mathematical model of replicative senescence.
The cell composition of a telomerase-deficient population evolves over time. Initially, the population consists of cells that enter senescence when their shortest telomere reaches a critical length. As these cells become exhausted and the population growth slows, cells experiencing non-terminal arrest begin to accumulate, as their frequency increases with telomere shortening. These cells enter senescence in a manner independent of the length of their shortest telomere. We speculate that these cells could potentially become post-senescence survivors, leading to renewed population growth.

Similar articles

References

    1. Hanahan, D. & Weinberg, R. A. Hallmarks of cancer: the next generation. Cell144, 646–674 (2011). - PubMed
    1. Xu, Z. & Teixeira, M. T. The many types of heterogeneity in replicative senescence. Yeast36, 637–648 (2019). - PMC - PubMed
    1. Campisi, J. & d'Adda di Fagagna, F. Cellular senescence: when bad things happen to good cells. Nat. Rev. Mol. Cell Biol.8, 729–740 (2007). - PubMed
    1. Artandi, S. E. & DePinho, R. A. Telomeres and telomerase in cancer. Carcinogenesis31, 9–18 (2010). - PMC - PubMed
    1. Bryan, T. M., Englezou, A., Dalla-Pozza, L., Dunham, M. A. & Reddel, R. R. Evidence for an alternative mechanism for maintaining telomere length in human tumors and tumor-derived cell lines. Nat Med3, 1271–1274 (1997). - PubMed

LinkOut - more resources