. 2025 Jan 25;15(1):3192.
doi: 10.1038/s41598-025-86644-1.

Overexpression of PLCG2 and TMEM38A inhibit tumor progression in clear cell renal cell carcinoma

Affiliations

Overexpression of PLCG2 and TMEM38A inhibit tumor progression in clear cell renal cell carcinoma

Yiqiao Zhao et al. Sci Rep. .

Abstract

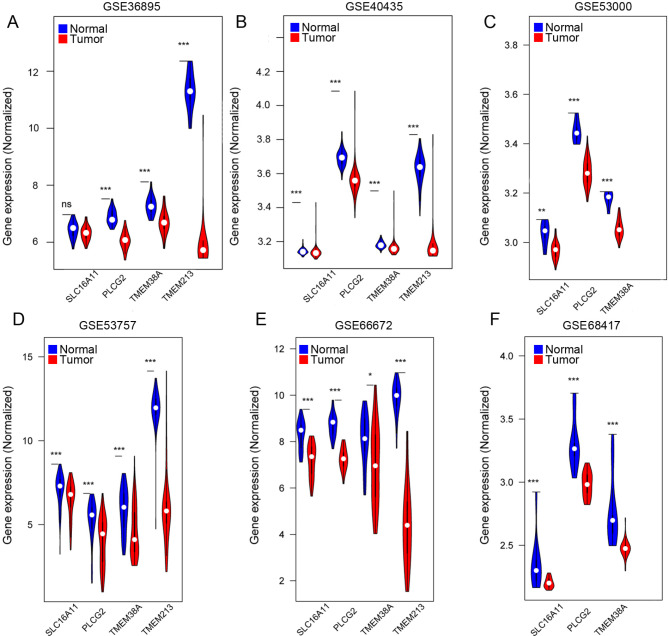
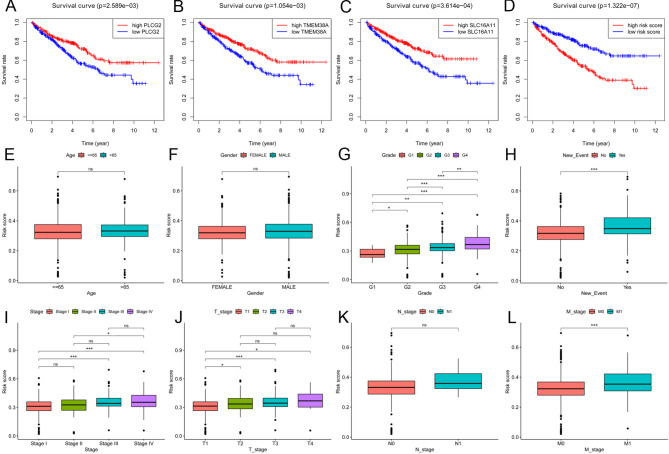
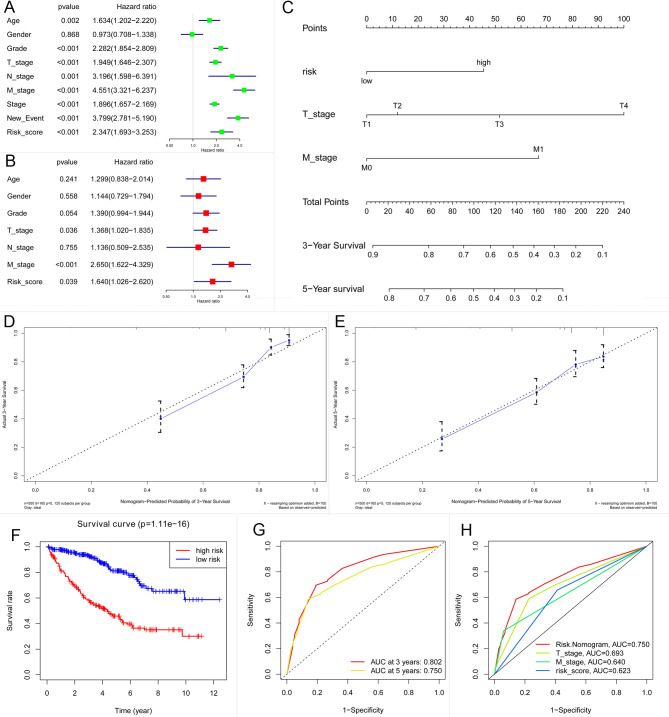
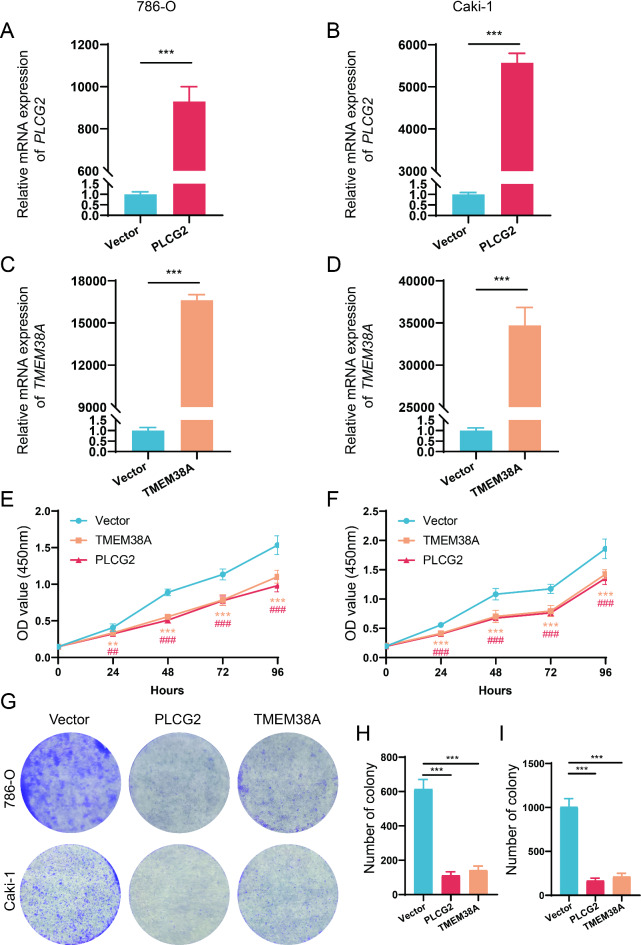
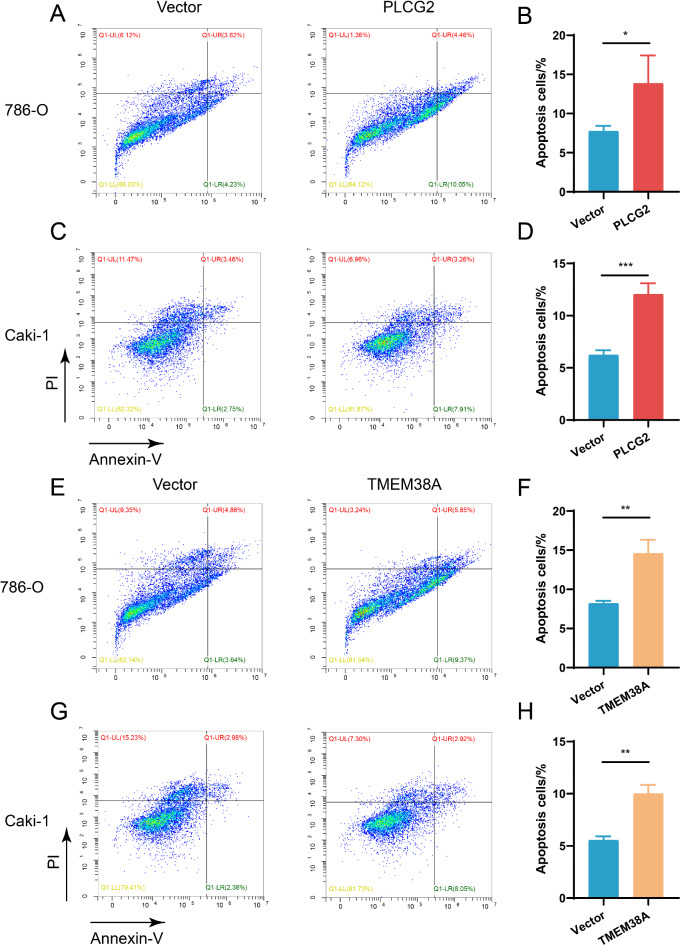
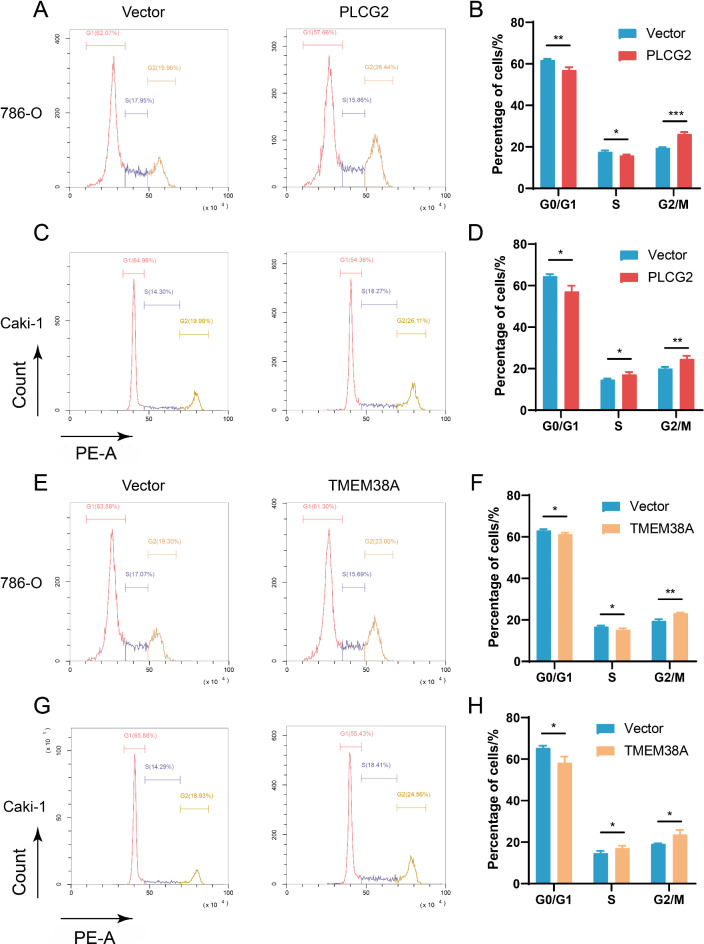
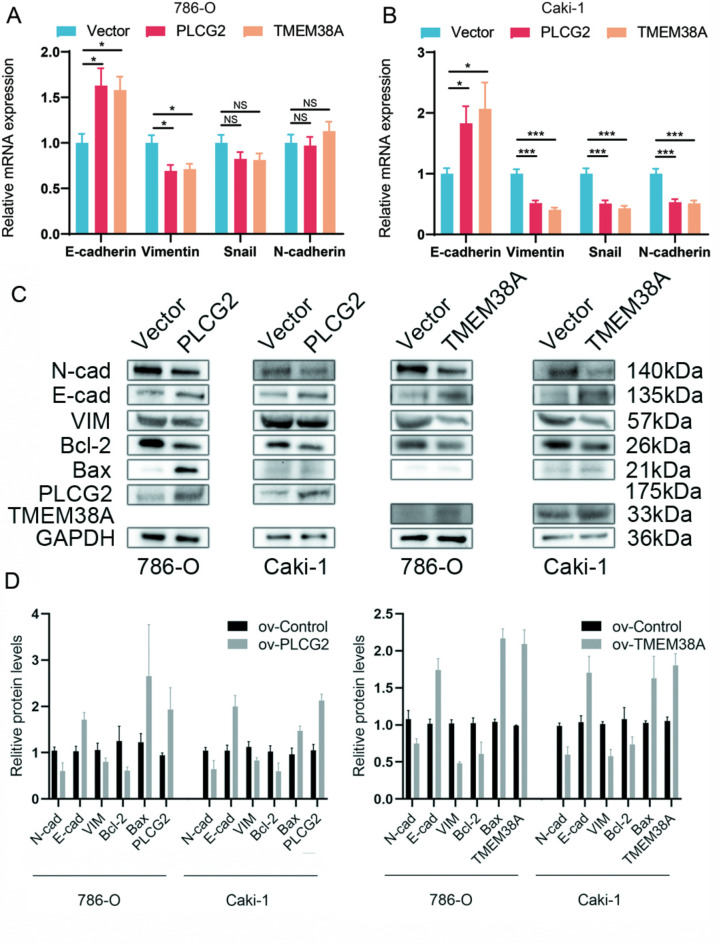
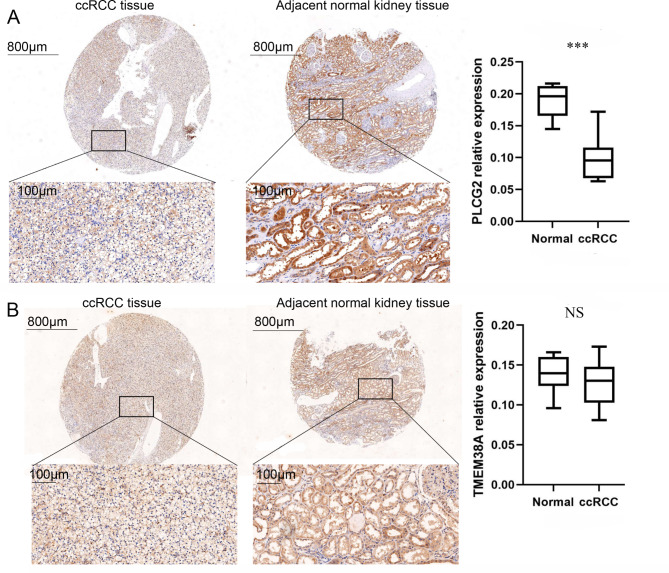
Clear cell renal cell carcinoma is a prevalent urological malignancy, imposing substantial burdens on both patients and society. In our study, we used bioinformatics methods to select four putative target genes associated with EMT and prognosis and developed a nomogram model which could accurately predicting 5-year patient survival rates. We further analyzed proteome and single-cell data and selected PLCG2 and TMEM38A for the following experiments. Overexpression models of PLCG2 and TMEM38A were generated in Caki-1 and 786-O cell lines using plasmids. The in vitro experiments demonstrated that both of them exerted pro-apoptotic effects on Caki-1 and 786-O cells, inducing G2/M phase arrest, inhibiting proliferation, and suppressing EMT. In summary, we identified potential tumor suppressor factors and stratified ccRCC patients into high-risk and low-risk groups based on these factors. Furthermore, we elucidated the impact of PLCG2 and TMEM38A in Caki-1 and 786-O cell lines, offering novel avenues for therapeutic target exploration.

Keywords: PDC; PLCG2; TCGA; TMEM38A; ccRCC.


Conflict of interest statement

Declarations. Competing interests: The authors declare no competing interests.

Figures

Fig. 1
Fig. 1
Validation of differential expression of EMT related prognostic genes. Violin plots of mRNA expression profiles of PLCG2, TMEM38A, SLC16A11 and TMEM213 in ccRCC patients from six GEO microarrays, it was observed that they were descended in tumor tissues in most of the validation sets (AF). NS means no significant difference, *p < 0.05, **p < 0.01, ***p < 0.001.
Fig. 2
Fig. 2
Prognostic analyses and correlation analyses of risk score and its components. (AD) K-M plots suggesting the prognostic values of risk score and its compositions. The prognostic value of risk score was obviously better those of its components. (EL) Correlation analyses indicated that higher risk score had stronger associations with M stage, tumor grade and new events (distant metastasis, recurrence etc.). NS means no significant difference, *p < 0.05, **p < 0.01, ***p < 0.001.
Fig. 3
Fig. 3
Evaluation of risk score and construction of nomogram model. (A, B) The results of univariate and multivariate cox analyses revealed that risk score could act as an independent prognostic factor. (C) Then we constructed a nomogram model by independent prognostic factors and (D, E) assessed its prognostic ability by 3 and 5-year calibration curves. (F–H) Survival analysis suggested that nomogram model could better predict ccRCC patients’ overall survival.
Fig. 4
Fig. 4
The efficacy of plasmid and the proliferation change caused by overexpression in 786-O and Caki-1 cell line. (A) The relative expression of PLCG2 in 786-O cell line after transfected with plasmid at the mRNA level. (B) The relative expression of PLCG2 in Caki-1 cell line after transfected with plasmid at the mRNA level. (C) The relative expression of TMEM38A in PLCG2 cell line after transfected with plasmid at the mRNA level. (D) The relative expression of TMEM38A in Caki-1 cell line after transfected with plasmid at the mRNA level. (E) The cell viability of 786-O cell line after transfection at different time points (0, 24, 48, 72, 96 h) detected by CCK-8 assay. *: TMEM38A vs vector. #: PLCG2 vs vector. (F) The cell viability of Caki-1 cell line after transfection at different time points (0, 24, 48, 72, 96 h) detected by CCK-8 assay. *: TMEM38A vs vector. #: PLCG2 vs vector. (G) The results of colony-formation assay after overexpression of PLCG2 and TMEM38A in both 786-O and Caki-1 cell line. (H) Statistical results of colony-formation assay in 786-O cell line. (I)Statistical results of colony-formation assay in Caki-1 cell line. ##/**p < 0.01, ###/***p < 0.001.
Fig. 5
Fig. 5
Overexpression of PLCG2 and TMEM38A promote cell apoptosis in 786-O and Caki-1 cell line. (A, B) After transfected with either PLCG2 plasmid and vector, the apoptotic cells staining with Annexin V and PI were detected by flow cytometry. (C, D) Flow cytometry analysis and statistical findings of apoptosis following PLCG2 overexpression in the Caki-1 cell line. (E, F) Flow cytometry analysis and statistical findings of apoptosis following TMEM38A overexpression in the 786-O cell line. (G, H) Flow cytometry analysis and statistical findings of apoptosis following TMEM38A overexpression in the Caki-1 cell line. **p < 0.01.
Fig. 6
Fig. 6
The overexpression of PLCG2 and TMEM38A resulted in G2 phase arrest in 786-O and Caki-1 cell line. (A) Cell cycle results detected by flow cytometry in 786-O cells transfected with PLCG2 plasmid. (B) The percentage of cell population (%) at different cell cycle stages (G0/G1, S, G2/M). (C, D) The effect of PLCG2 overexpression on cell cycle in Caki-1 cell line. (E, F) The effect of TMEM38A overexpression on cell cycle in 786-O cell line. (G, H) The effect of TMEM38A overexpression on cell cycle in Caki-1 cell line. *p < 0.05, **p < 0.01.
Fig. 7
Fig. 7
Changes in the expression of EMT-associated markers following overexpression of PLCG2 and TMEM38A. (A) The relative profiles of E-cadherin, Vimentin, snail and N-cadherin in 786-O cell line at the mRNA level. (B) The relative expression of E-cadherin, Vimentin, snail and N-cadherin in Caki-1 cell line at the mRNA level. (C, D) The relative protein levels as well as the corresponding quantitative data of EMT markers (N-cadherin, E-cadherin and Vimentin), apoptosis markers (Bcl-2 and Bax) and target proteins (PLCG2 and TMEM38A) in both cell lines following the elevation of PLCG2 and TMEM38A. *p < 0.05***p < 0.001, NS means no significant difference.
Fig. 8
Fig. 8
Immunostaining of PLCG2 and TMEM38A in native human ccRCC and adjacent non-tumor kidney tissues tissues. (A) Representative IHC images and quantitative analysis of PLCG2 in ccRCC and normal kidney tissues (B) Representative IHC images and quantitative analysis of TMEM38A in ccRCC and normal kidney tissues. ***p < 0.01,  NS means no significant difference.

Similar articles

References

    1. Sung, H. et al. Global cancer statistics 2020: GLOBOCAN estimates of incidence and mortality worldwide for 36 cancers in 185 countries. CA Cancer J. Clin.71(3), 209–249 (2021). - PubMed
    1. Bukavina, L. et al. Epidemiology of renal cell carcinoma: 2022 update. Eur Urol.82(5), 529–542 (2022). - PubMed
    1. Bahadoram, S. et al. Renal cell carcinoma: an overview of the epidemiology, diagnosis, and treatment. G. Ital. Nefrol.39(3), 1 (2022). - PubMed
    1. Znaor, A., Lortet-Tieulent, J., Laversanne, M., Jemal, A. & Bray, F. International variations and trends in renal cell carcinoma incidence and mortality. Eur. Urol.67(3), 519–530 (2015). - PubMed
    1. Makhov, P. et al. Resistance to systemic therapies in clear cell renal cell carcinoma: Mechanisms and management strategies. Mol. Cancer Ther.17(7), 1355–1364 (2018). - PMC - PubMed

Publication types

LinkOut - more resources