

Characterizing the omics landscape based on 10,000+ datasets
- PMID: 39863642
- PMCID: PMC11762699
- DOI: 10.1038/s41598-025-87256-5
Characterizing the omics landscape based on 10,000+ datasets
Abstract
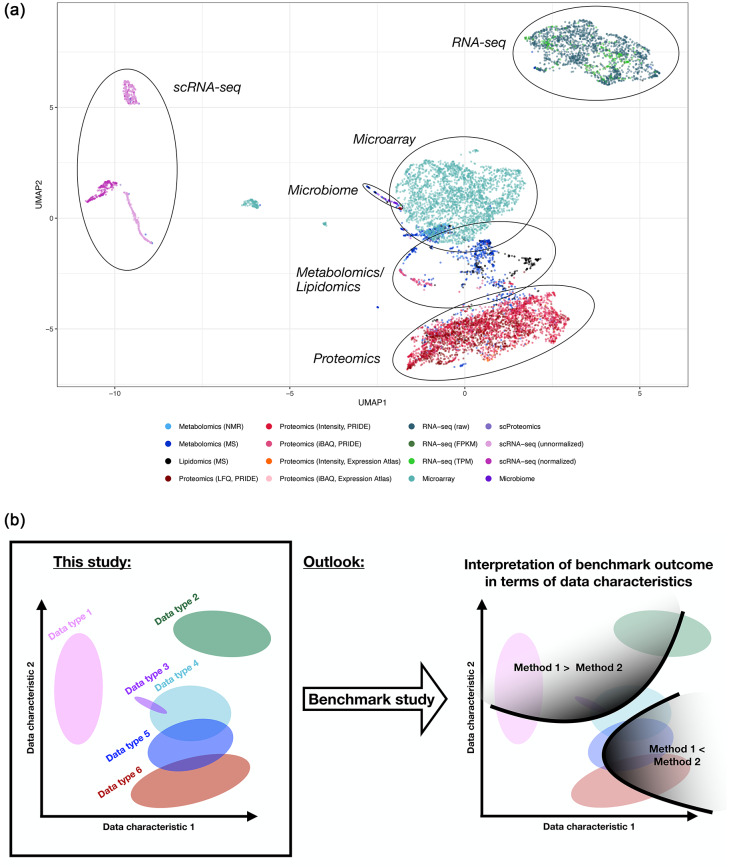
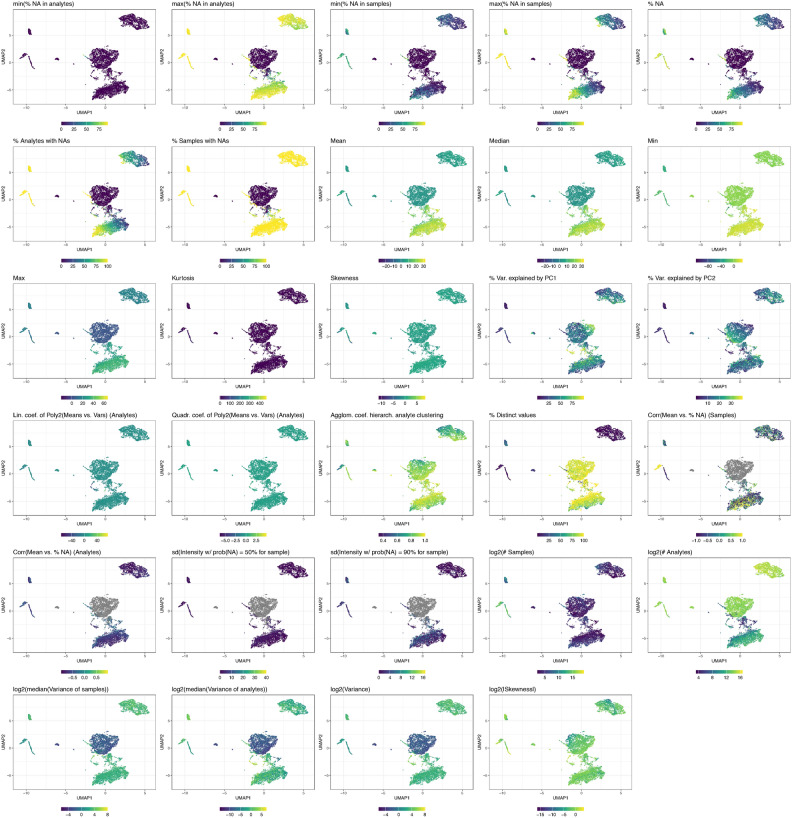
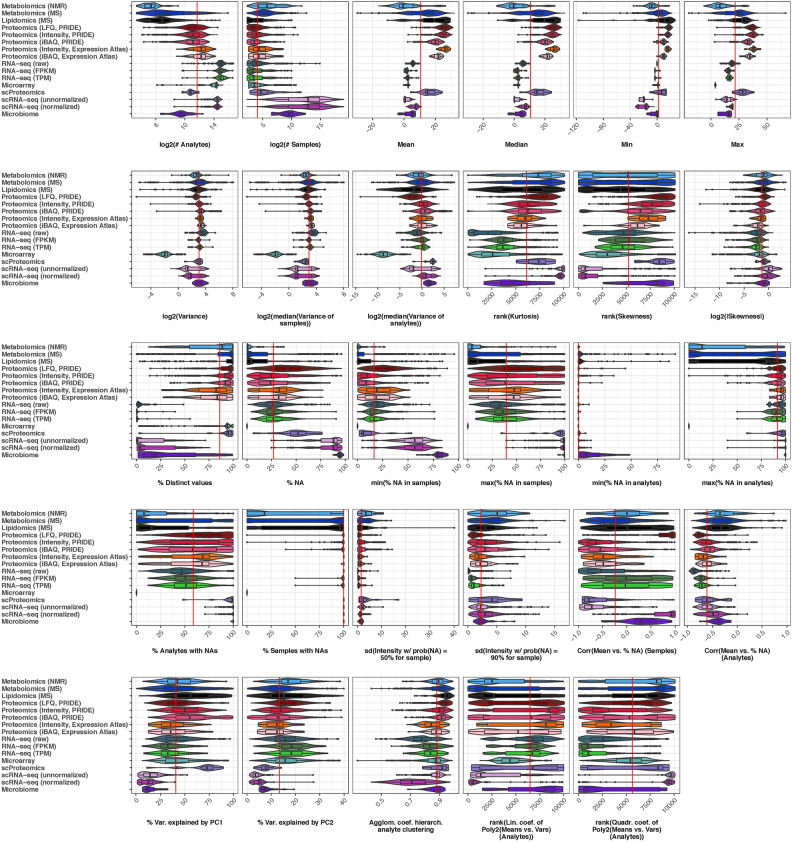
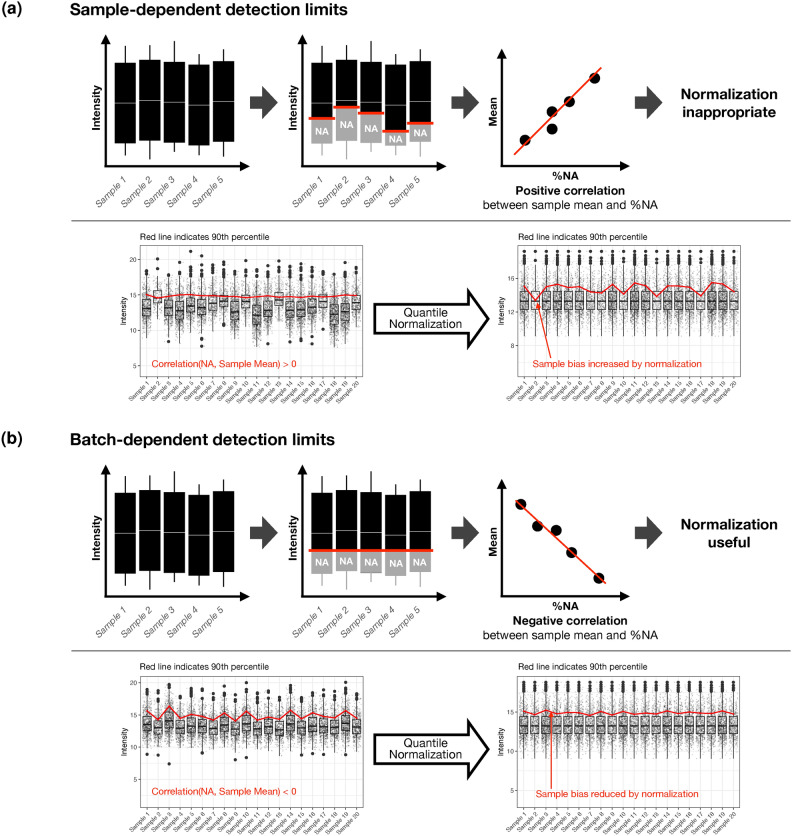
The characteristics of data produced by omics technologies are pivotal, as they critically influence the feasibility and effectiveness of computational methods applied in downstream analyses, such as data harmonization and differential abundance analyses. Furthermore, variability in these data characteristics across datasets plays a crucial role, leading to diverging outcomes in benchmarking studies, which are essential for guiding the selection of appropriate analysis methods in all omics fields. Additionally, downstream analysis tools are often developed and applied within specific omics communities due to the presumed differences in data characteristics attributed to each omics technology. In this study, we investigate over ten thousand datasets to understand how proteomics, metabolomics, lipidomics, transcriptomics, and microbiome data vary in specific data characteristics. We were able to show patterns of data characteristics specific to the investigated omics types and provide a tool that enables researchers to assess how representative a given omics dataset is for its respective discipline. Moreover, we illustrate how data characteristics can impact analyses at the example of normalization in the presence of sample-dependent proportions of missing values. Given the variability of omics data characteristics, we encourage the systematic inspection of these characteristics in benchmark studies and for downstream analyses to prevent suboptimal method selection and unintended bias.
© 2025. The Author(s).
Conflict of interest statement
Declarations. Competing interests: The authors declare no competing interests.
Figures
Similar articles
-
Evaluation of normalization strategies for mass spectrometry-based multi-omics datasets.Metabolomics. 2025 Jul 1;21(4):98. doi: 10.1007/s11306-025-02297-1. Metabolomics. 2025. PMID: 40593232 Free PMC article.
-
Assessing the comparative effects of interventions in COPD: a tutorial on network meta-analysis for clinicians.Respir Res. 2024 Dec 21;25(1):438. doi: 10.1186/s12931-024-03056-x. Respir Res. 2024. PMID: 39709425 Free PMC article. Review.
-
Molecular feature-based classification of retroperitoneal liposarcoma: a prospective cohort study.Elife. 2025 May 23;14:RP100887. doi: 10.7554/eLife.100887. Elife. 2025. PMID: 40407808 Free PMC article.
-
Graph neural networks for single-cell omics data: a review of approaches and applications.Brief Bioinform. 2025 Mar 4;26(2):bbaf109. doi: 10.1093/bib/bbaf109. Brief Bioinform. 2025. PMID: 40091193 Free PMC article.
-
Defining disease severity in atopic dermatitis and psoriasis for the application to biomarker research: an interdisciplinary perspective.Br J Dermatol. 2024 Jun 20;191(1):14-23. doi: 10.1093/bjd/ljae080. Br J Dermatol. 2024. PMID: 38419411 Free PMC article. Review.
Cited by
-
Evaluation of normalization strategies for mass spectrometry-based multi-omics datasets.Metabolomics. 2025 Jul 1;21(4):98. doi: 10.1007/s11306-025-02297-1. Metabolomics. 2025. PMID: 40593232 Free PMC article.
References
-
- Strobl, C. & Leisch, F. Against the “one method fits all data sets” philosophy for comparison studies in methodological research. Biometrical Journal (2022). - PubMed
-
- Nießl, C., Herrmann, M., Wiedemann, C., Casalicchio, G. & Boulesteix, A.-L. Over-optimism in benchmark studies and the multiplicity of design and analysis options when interpreting their results. Wiley Interdisciplinary Reviews: Data Mining and Knowledge Discovery12, e1441 (2022).
-
- Nießl, C., Hoffmann, S., Ullmann, T. & Boulesteix, A.-L. Explaining the optimistic performance evaluation of newly proposed methods: A cross-design validation experiment. Biometrical Journal 2200238 (2023). - PubMed
Publication types
MeSH terms
LinkOut - more resources
Full Text Sources
