. 2025 Dec;17(1):2455790.
doi: 10.1080/19490976.2025.2455790. Epub 2025 Jan 26.

Mucus-penetrating microbiota drive chronic low-grade intestinal inflammation and metabolic dysregulation

Affiliations

Mucus-penetrating microbiota drive chronic low-grade intestinal inflammation and metabolic dysregulation

Melissa C Kordahi et al. Gut Microbes. 2025 Dec.

Abstract

Metabolic syndrome is, in humans, associated with alterations in the composition and localization of the intestinal microbiota, including encroachment of bacteria within the colon's inner mucus layer. Possible promoters of these events include dietary emulsifiers, such as carboxymethylcellulose (CMC) and polysorbate-80 (P80), which, in mice, result in altered microbiota composition, encroachment, low-grade inflammation and metabolic syndrome. While assessments of gut microbiota composition have largely focused on fecal/luminal samples, we hypothesize an outsized role for changes in mucus microbiota in driving low-grade inflammation and its consequences. In support of this notion, we herein report that both CMC and P80 led to stark changes in the mucus microbiome, markedly distinct from those observed in feces. Moreover, transfer of mucus microbiota from CMC- and P80-fed mice to germfree mice resulted in microbiota encroachment, low-grade inflammation, and various features of metabolic syndrome. Thus, we conclude that mucus-associated bacteria are pivotal determinants of intestinal inflammatory tone and host metabolism.

Keywords: Microbiota; encroachment; inflammation; metabolic deregulations; mucus.


Conflict of interest statement

No potential conflict of interest was reported by the author(s).

Figures
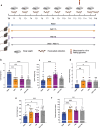
Figure 1.
Figure 1.
Dietary emulsifiers consumption reproducibly drives chronic low-grade intestinal inflammation and metabolic dysregulations. (a) Schematic representation of the experimental design used. Mice were exposed to drinking water (blue) containing 1.0% of CMC (orange), P80 (purple), or CMC + P80 (gray) for 16 weeks. (b) Colon length, (c) spleen weight (d) histopathological scoring of intestinal inflammation on H&E-stained colonic sections, (e) epididymal fat pad weight and (f) 15-hours fasting blood glucose level. Data are represented as means ± SD. N = 15. For bar graphs, statistical analyses were performed using a one-way ANOVA followed by a Bonferroni post hoc test and significant differences were recorded as follows: *p < 0.05, **p < 0.01, ***p < 0.001. ANOVA, analysis of variance; CMC, carboxymethylcellulose; P80, polysorbate 80.
Figure 2.
Figure 2.
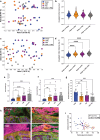
Dietary emulsifiers consumption reproducibly drives intestinal microbiota alterations, increasing microbiota pro-inflammatory potential and promoting microbiota encroachment. Bacterial DNA was extracted from feces samples and subjected to 16S rRNA gene sequencing on week 0 and week 16 of the protocol. (a, c) Principal coordinates analysis (PcoA) of the unweighted Unifrac distance matrices of microbiota composition at week 0 (a) and week 16 (c) and assessed by 16S rRNA gene sequencing. Each dot represents an individual animal and are colored by experimental group (blue, Water; orange, CMC; purple, P80; grey, CMC + P80). (b, d) unweighted Unifrac distances at week 0 (b) and week 16 (d) of the protocol separating water-treated mice and water- (blue), CMC- (orange), P80- (purple) or CMC + P80- (gray) treated mice. (e-f) fecal levels of anti-flagellin (e) and anti-lps (f) IgA. (g) Colonic biopsies were subjected to immunostaining paired with fluorescent in situ hybridization (FISH) followed by confocal microscopy analysis of microbiota localization. (h) Representative pictures obtained from 5 biological replicates. MUC2, green; actin, purple; bacteria, red; and DNA, blue. Scale bar, 50 µm (i) distances of the closest bacteria to intestinal epithelial cells (IEC), measured using 5 high-powered fields per mouse and plotted versus fasting blood glucose concentration. Data are represented as means ± SD. N = 15. For bar graphs, statistical analyses were performed using a one-way ANOVA followed by a Bonferroni post hoc test and significant differences were recorded as follows: *p < 0.05, **p < 0.01, ***p < 0.001. ANOVA, analysis of variance; CMC, carboxymethylcellulose; P80, polysorbate 80.
Figure 3.
Figure 3.
Dietary emulsifiers consumption alters microbiota composition at the mucosal level. Mucus-associated DNA was extracted from laser capture micro-dissected inner mucus layer and subjected to 16S rRNA gene amplification and sequencing. (a) Principal coordinates analysis (PCoA) of the unweighted Unifrac distance matrix of microbiota composition assessed by 16S rRNA gene sequencing. Each dot represents an individual animal and are colored by experimental group (blue, Water; orange, CMC; purple, P80). (b) Unweighted Unifrac distances at week 16. (c) Simpson diversity index at week 16. (d) Significantly differentially abundant features were identified using microbiome multivariable associations with linear models (MaAslin 2) approach, presented as heatmaps. In bar graphs, data are represented as means ± SD. N = 5–15. Statistical analyses were performed using a one-way ANOVA followed by a Bonferroni post-hoc test and significant differences were recorded as follows: *p < 0.05, **p < 0.01, ***p < 0.001. ANOVA, analysis of variance; CMC, carboxymethylcellulose; P80, polysorbate 80.
Figure 4.
Figure 4.
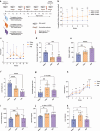
Transplantation of mucus-associated microbiota is sufficient to transfer microbiota encroachment and associated chronic intestinal inflammation and metabolic dysregulations in germ-free recipient naive mice. (a) Schematic representation of the experimental design used. Germ-free mice were inoculated with mucosal biopsy homogenates from mice having consumed water (blue), CMC (orange) or P80 (purple). Body weight was measured over time and feces were collected every other week. (b) Longitudinal analysis of the unweighted unifrac distance matrix of the intestinal microbiota assessed by 16S rRNA gene sequencing. Unweighted unifrac distances were normalized to water-water distances, defined as 1. (c) Longitudinal analysis of bioactive fecal LPS levels. Fecal LPS levels were normalized to levels in the control group, defined as 1. (d) Colon was subjected to immunostaining paired with fluorescent in situ hybridization (FISH) followed by confocal microscopy analysis of microbiota localization. Distances of closest bacteria to intestinal epithelial cells (IEC) per condition over five high-powered fields per mouse. (e) Spleen weight, (f) colon length, and (g) histopathological scoring of intestinal inflammation on H&E-stained colonic sections. (h) Body weight gain over time, (i) epididymal fat pad weight, (j) 15-hours fasting blood glucose levels, and (k) liver steatosis scoring. Data are represented as means ± SD. N = 8–9. For bar graphs, statistical analyses were performed using a one-way ANOVA followed by a Bonferroni post hoc test and significant differences were recorded as follows: *p < 0.05, **p < 0.01, ***p < 0.001, ****p < 0.0001. ANOVA, analysis of variance; CMC, carboxymethylcellulose; P80, polysorbate 80.

References

    1. Thursby E, Juge N.. Introduction to the human gut microbiota. Biochem J. 2017;474(11):1823. doi:10.1042/BCJ20160510. - DOI - PMC - PubMed
    1. Vijay-Kumar M, Bovilla VR, Yeoh BS, Golonka RM, Saha P, Joe B, Gewirtz AT. Bacterial flagellin is a dominant, stable innate immune activator in the gastrointestinal contents of mice and rats. Gut Microbes. 2023;15(1):2185031. doi:10.1080/19490976.2023.2185031. - DOI - PMC - PubMed
    1. Duerkop BA, Vaishnava S, Hooper LV. Immune responses to the microbiota at the intestinal mucosal surface. Immunity. 2009;31(3):368–18. doi:10.1016/j.immuni.2009.08.009. - DOI - PubMed
    1. Paone P, Cani PD. Mucus barrier, mucins and gut microbiota: the expected slimy partners? Gut. 2020;69(12):2232–2243. doi:10.1136/gutjnl-2020-322260. - DOI - PMC - PubMed
    1. Wang R, Moniruzzaman M, Wong KY, Wiid P, Harding A, Giri R, Tong W, Creagh J, Begun J, McGuckin MA, et al. Gut microbiota shape the inflammatory response in mice with an epithelial defect. Gut Microbes. 2021;13(1):1887720. doi:10.1080/19490976.2021.1887720. - DOI - PMC - PubMed

Substances

LinkOut - more resources